White/Caucasian vs Immigrants from Fiji Unemployment Among Seniors over 75 years
COMPARE
White/Caucasian
Immigrants from Fiji
Unemployment Among Seniors over 75 years
Unemployment Among Seniors over 75 years Comparison
Whites/Caucasians
Immigrants from Fiji
10.1%
UNEMPLOYMENT AMONG SENIORS OVER 75 YEARS
0.0/ 100
METRIC RATING
308th/ 347
METRIC RANK
10.0%
UNEMPLOYMENT AMONG SENIORS OVER 75 YEARS
0.0/ 100
METRIC RATING
307th/ 347
METRIC RANK
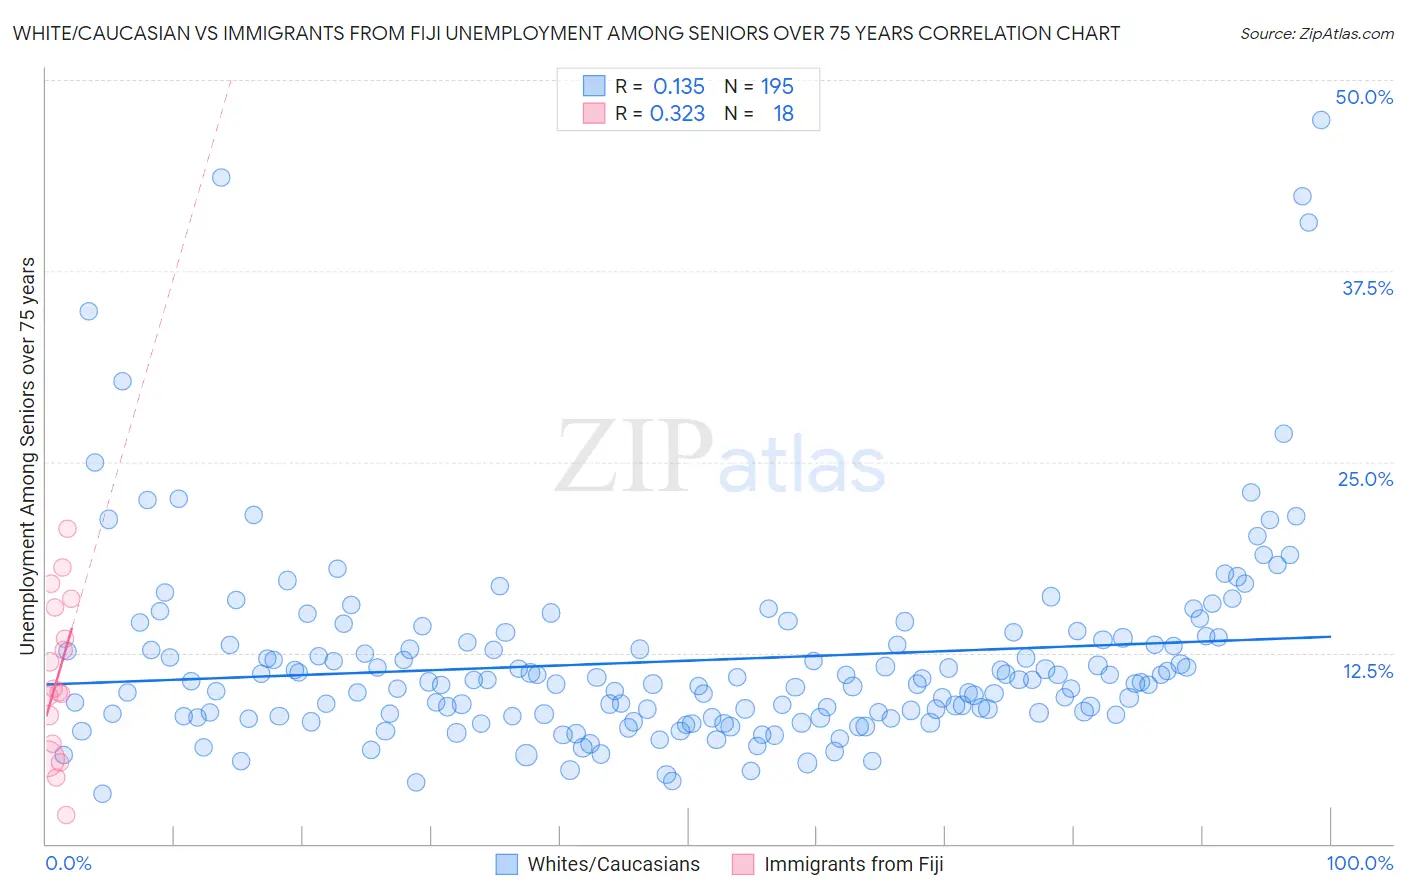
White/Caucasian vs Immigrants from Fiji Unemployment Among Seniors over 75 years Correlation Chart
The statistical analysis conducted on geographies consisting of 235,408,651 people shows a poor positive correlation between the proportion of Whites/Caucasians and unemployment rate among seniors over the age of 75 in the United States with a correlation coefficient (R) of 0.135 and weighted average of 10.1%. Similarly, the statistical analysis conducted on geographies consisting of 71,825,533 people shows a mild positive correlation between the proportion of Immigrants from Fiji and unemployment rate among seniors over the age of 75 in the United States with a correlation coefficient (R) of 0.323 and weighted average of 10.0%, a difference of 0.44%.
Unemployment Among Seniors over 75 years Correlation Summary
| Measurement | White/Caucasian | Immigrants from Fiji |
| Minimum | 3.3% | 1.9% |
| Maximum | 47.4% | 20.6% |
| Range | 44.1% | 18.7% |
| Mean | 12.0% | 10.9% |
| Median | 10.6% | 10.0% |
| Interquartile 25% (IQ1) | 8.4% | 6.5% |
| Interquartile 75% (IQ3) | 13.4% | 15.4% |
| Interquartile Range (IQR) | 5.0% | 8.9% |
| Standard Deviation (Sample) | 6.5% | 5.2% |
| Standard Deviation (Population) | 6.5% | 5.0% |
Demographics Similar to Whites/Caucasians and Immigrants from Fiji by Unemployment Among Seniors over 75 years
In terms of unemployment among seniors over 75 years, the demographic groups most similar to Whites/Caucasians are English (10.1%, a difference of 0.070%), Hungarian (10.1%, a difference of 0.25%), Scottish (10.1%, a difference of 0.37%), Chippewa (10.1%, a difference of 0.38%), and Nepalese (10.1%, a difference of 0.50%). Similarly, the demographic groups most similar to Immigrants from Fiji are Italian (10.0%, a difference of 0.13%), Swedish (10.0%, a difference of 0.27%), Puget Sound Salish (10.0%, a difference of 0.47%), Scotch-Irish (10.0%, a difference of 0.47%), and English (10.1%, a difference of 0.51%).
| Demographics | Rating | Rank | Unemployment Among Seniors over 75 years |
| Cherokee | 0.0 /100 | #297 | Tragic 9.8% |
| Lithuanians | 0.0 /100 | #298 | Tragic 9.9% |
| Belgians | 0.0 /100 | #299 | Tragic 9.9% |
| Iraqis | 0.0 /100 | #300 | Tragic 9.9% |
| Welsh | 0.0 /100 | #301 | Tragic 10.0% |
| Finns | 0.0 /100 | #302 | Tragic 10.0% |
| Puget Sound Salish | 0.0 /100 | #303 | Tragic 10.0% |
| Scotch-Irish | 0.0 /100 | #304 | Tragic 10.0% |
| Swedes | 0.0 /100 | #305 | Tragic 10.0% |
| Italians | 0.0 /100 | #306 | Tragic 10.0% |
| Immigrants | Fiji | 0.0 /100 | #307 | Tragic 10.0% |
| Whites/Caucasians | 0.0 /100 | #308 | Tragic 10.1% |
| English | 0.0 /100 | #309 | Tragic 10.1% |
| Hungarians | 0.0 /100 | #310 | Tragic 10.1% |
| Scottish | 0.0 /100 | #311 | Tragic 10.1% |
| Chippewa | 0.0 /100 | #312 | Tragic 10.1% |
| Nepalese | 0.0 /100 | #313 | Tragic 10.1% |
| Dutch West Indians | 0.0 /100 | #314 | Tragic 10.2% |
| Pennsylvania Germans | 0.0 /100 | #315 | Tragic 10.2% |
| Natives/Alaskans | 0.0 /100 | #316 | Tragic 10.2% |
| Irish | 0.0 /100 | #317 | Tragic 10.2% |