Estonian vs Albanian Unemployment Among Seniors over 75 years
COMPARE
Estonian
Albanian
Unemployment Among Seniors over 75 years
Unemployment Among Seniors over 75 years Comparison
Estonians
Albanians
8.8%
UNEMPLOYMENT AMONG SENIORS OVER 75 YEARS
33.3/ 100
METRIC RATING
191st/ 347
METRIC RANK
8.6%
UNEMPLOYMENT AMONG SENIORS OVER 75 YEARS
72.8/ 100
METRIC RATING
161st/ 347
METRIC RANK
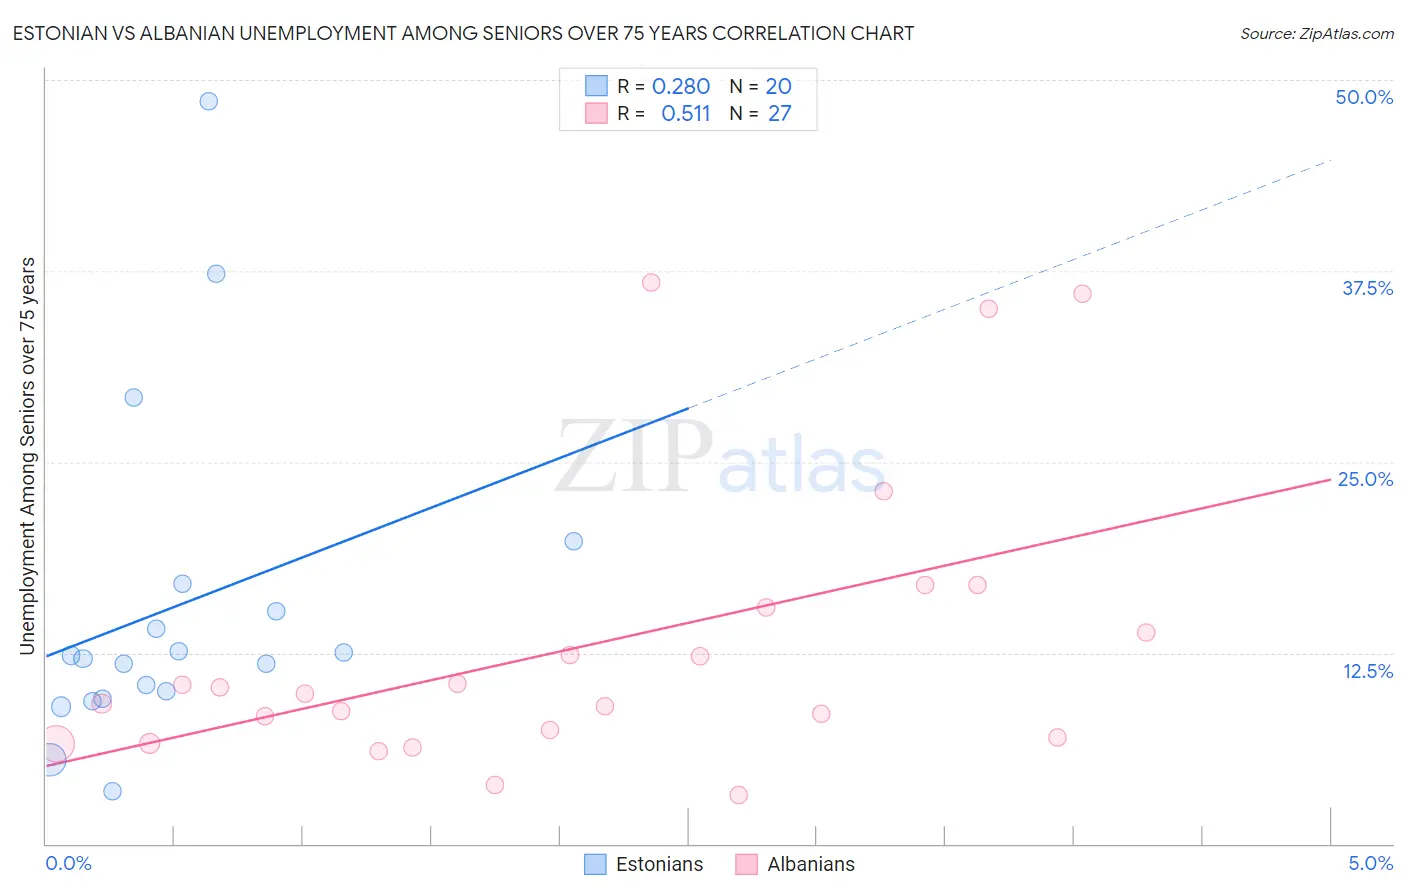
Estonian vs Albanian Unemployment Among Seniors over 75 years Correlation Chart
The statistical analysis conducted on geographies consisting of 88,437,041 people shows a weak positive correlation between the proportion of Estonians and unemployment rate among seniors over the age of 75 in the United States with a correlation coefficient (R) of 0.280 and weighted average of 8.8%. Similarly, the statistical analysis conducted on geographies consisting of 122,641,631 people shows a substantial positive correlation between the proportion of Albanians and unemployment rate among seniors over the age of 75 in the United States with a correlation coefficient (R) of 0.511 and weighted average of 8.6%, a difference of 2.3%.
Unemployment Among Seniors over 75 years Correlation Summary
| Measurement | Estonian | Albanian |
| Minimum | 3.5% | 3.2% |
| Maximum | 48.6% | 36.8% |
| Range | 45.1% | 33.5% |
| Mean | 15.6% | 13.0% |
| Median | 12.2% | 9.8% |
| Interquartile 25% (IQ1) | 9.7% | 6.9% |
| Interquartile 75% (IQ3) | 16.1% | 15.4% |
| Interquartile Range (IQR) | 6.4% | 8.5% |
| Standard Deviation (Sample) | 10.9% | 9.3% |
| Standard Deviation (Population) | 10.6% | 9.2% |
Similar Demographics by Unemployment Among Seniors over 75 years
Demographics Similar to Estonians by Unemployment Among Seniors over 75 years
In terms of unemployment among seniors over 75 years, the demographic groups most similar to Estonians are Mexican American Indian (8.8%, a difference of 0.080%), Immigrants from Eastern Europe (8.8%, a difference of 0.090%), Immigrants from Haiti (8.8%, a difference of 0.090%), Immigrants from Kenya (8.8%, a difference of 0.090%), and Immigrants from Europe (8.8%, a difference of 0.12%).
| Demographics | Rating | Rank | Unemployment Among Seniors over 75 years |
| Immigrants | Micronesia | 37.2 /100 | #184 | Fair 8.8% |
| Choctaw | 37.1 /100 | #185 | Fair 8.8% |
| Immigrants | Ethiopia | 36.2 /100 | #186 | Fair 8.8% |
| Immigrants | Europe | 35.2 /100 | #187 | Fair 8.8% |
| Immigrants | Eastern Europe | 34.7 /100 | #188 | Fair 8.8% |
| Immigrants | Haiti | 34.7 /100 | #189 | Fair 8.8% |
| Mexican American Indians | 34.7 /100 | #190 | Fair 8.8% |
| Estonians | 33.3 /100 | #191 | Fair 8.8% |
| Immigrants | Kenya | 31.8 /100 | #192 | Fair 8.8% |
| Immigrants | Guyana | 29.9 /100 | #193 | Fair 8.8% |
| Maltese | 29.2 /100 | #194 | Fair 8.8% |
| Okinawans | 28.9 /100 | #195 | Fair 8.8% |
| Immigrants | Jamaica | 27.7 /100 | #196 | Fair 8.9% |
| Immigrants | Laos | 26.3 /100 | #197 | Fair 8.9% |
| Eastern Europeans | 25.9 /100 | #198 | Fair 8.9% |
Demographics Similar to Albanians by Unemployment Among Seniors over 75 years
In terms of unemployment among seniors over 75 years, the demographic groups most similar to Albanians are Cree (8.6%, a difference of 0.0%), Immigrants from South America (8.6%, a difference of 0.10%), Shoshone (8.6%, a difference of 0.13%), Ethiopian (8.6%, a difference of 0.17%), and Immigrants from Bahamas (8.6%, a difference of 0.26%).
| Demographics | Rating | Rank | Unemployment Among Seniors over 75 years |
| Immigrants | Pakistan | 79.7 /100 | #154 | Good 8.6% |
| Ecuadorians | 78.5 /100 | #155 | Good 8.6% |
| Immigrants | Bahamas | 76.5 /100 | #156 | Good 8.6% |
| Turks | 76.4 /100 | #157 | Good 8.6% |
| Ethiopians | 75.3 /100 | #158 | Good 8.6% |
| Shoshone | 74.6 /100 | #159 | Good 8.6% |
| Cree | 72.8 /100 | #160 | Good 8.6% |
| Albanians | 72.8 /100 | #161 | Good 8.6% |
| Immigrants | South America | 71.3 /100 | #162 | Good 8.6% |
| Immigrants | Guatemala | 68.4 /100 | #163 | Good 8.7% |
| Paraguayans | 62.2 /100 | #164 | Good 8.7% |
| Immigrants | Dominican Republic | 61.4 /100 | #165 | Good 8.7% |
| Immigrants | Belize | 57.6 /100 | #166 | Average 8.7% |
| Immigrants | Eastern Africa | 57.6 /100 | #167 | Average 8.7% |
| Immigrants | Lithuania | 57.2 /100 | #168 | Average 8.7% |