Immigrants from Burma/Myanmar vs Albanian Unemployment Among Seniors over 75 years
COMPARE
Immigrants from Burma/Myanmar
Albanian
Unemployment Among Seniors over 75 years
Unemployment Among Seniors over 75 years Comparison
Immigrants from Burma/Myanmar
Albanians
7.7%
UNEMPLOYMENT AMONG SENIORS OVER 75 YEARS
100.0/ 100
METRIC RATING
41st/ 347
METRIC RANK
8.6%
UNEMPLOYMENT AMONG SENIORS OVER 75 YEARS
72.8/ 100
METRIC RATING
161st/ 347
METRIC RANK
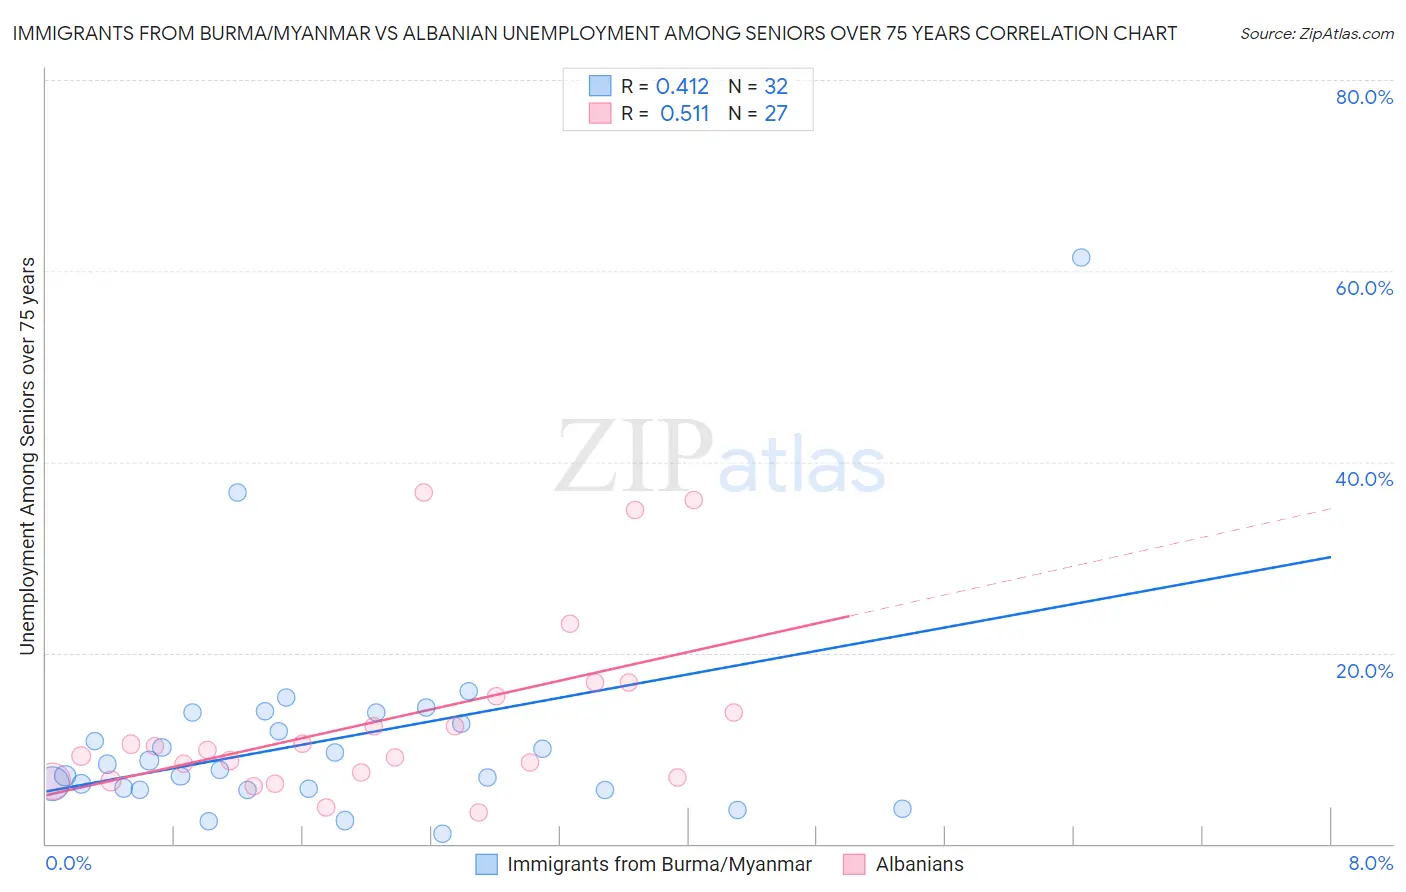
Immigrants from Burma/Myanmar vs Albanian Unemployment Among Seniors over 75 years Correlation Chart
The statistical analysis conducted on geographies consisting of 114,707,279 people shows a moderate positive correlation between the proportion of Immigrants from Burma/Myanmar and unemployment rate among seniors over the age of 75 in the United States with a correlation coefficient (R) of 0.412 and weighted average of 7.7%. Similarly, the statistical analysis conducted on geographies consisting of 122,641,631 people shows a substantial positive correlation between the proportion of Albanians and unemployment rate among seniors over the age of 75 in the United States with a correlation coefficient (R) of 0.511 and weighted average of 8.6%, a difference of 11.8%.
Unemployment Among Seniors over 75 years Correlation Summary
| Measurement | Immigrants from Burma/Myanmar | Albanian |
| Minimum | 1.1% | 3.2% |
| Maximum | 61.4% | 36.8% |
| Range | 60.3% | 33.5% |
| Mean | 10.9% | 13.0% |
| Median | 8.1% | 9.8% |
| Interquartile 25% (IQ1) | 5.7% | 6.9% |
| Interquartile 75% (IQ3) | 13.2% | 15.4% |
| Interquartile Range (IQR) | 7.5% | 8.5% |
| Standard Deviation (Sample) | 11.2% | 9.3% |
| Standard Deviation (Population) | 11.0% | 9.2% |
Similar Demographics by Unemployment Among Seniors over 75 years
Demographics Similar to Immigrants from Burma/Myanmar by Unemployment Among Seniors over 75 years
In terms of unemployment among seniors over 75 years, the demographic groups most similar to Immigrants from Burma/Myanmar are Colville (7.7%, a difference of 0.13%), Ugandan (7.7%, a difference of 0.16%), Kiowa (7.7%, a difference of 0.20%), Immigrants from Hungary (7.7%, a difference of 0.21%), and Pueblo (7.7%, a difference of 0.23%).
| Demographics | Rating | Rank | Unemployment Among Seniors over 75 years |
| Immigrants | Eritrea | 100.0 /100 | #34 | Exceptional 7.7% |
| Immigrants | Norway | 100.0 /100 | #35 | Exceptional 7.7% |
| Luxembourgers | 100.0 /100 | #36 | Exceptional 7.7% |
| Immigrants | Hungary | 100.0 /100 | #37 | Exceptional 7.7% |
| Kiowa | 100.0 /100 | #38 | Exceptional 7.7% |
| Ugandans | 100.0 /100 | #39 | Exceptional 7.7% |
| Colville | 100.0 /100 | #40 | Exceptional 7.7% |
| Immigrants | Burma/Myanmar | 100.0 /100 | #41 | Exceptional 7.7% |
| Pueblo | 100.0 /100 | #42 | Exceptional 7.7% |
| Immigrants | Denmark | 100.0 /100 | #43 | Exceptional 7.8% |
| Immigrants | Spain | 100.0 /100 | #44 | Exceptional 7.8% |
| British West Indians | 100.0 /100 | #45 | Exceptional 7.8% |
| Immigrants | China | 100.0 /100 | #46 | Exceptional 7.8% |
| Creek | 100.0 /100 | #47 | Exceptional 7.8% |
| Immigrants | Chile | 100.0 /100 | #48 | Exceptional 7.8% |
Demographics Similar to Albanians by Unemployment Among Seniors over 75 years
In terms of unemployment among seniors over 75 years, the demographic groups most similar to Albanians are Cree (8.6%, a difference of 0.0%), Immigrants from South America (8.6%, a difference of 0.10%), Shoshone (8.6%, a difference of 0.13%), Ethiopian (8.6%, a difference of 0.17%), and Immigrants from Bahamas (8.6%, a difference of 0.26%).
| Demographics | Rating | Rank | Unemployment Among Seniors over 75 years |
| Immigrants | Pakistan | 79.7 /100 | #154 | Good 8.6% |
| Ecuadorians | 78.5 /100 | #155 | Good 8.6% |
| Immigrants | Bahamas | 76.5 /100 | #156 | Good 8.6% |
| Turks | 76.4 /100 | #157 | Good 8.6% |
| Ethiopians | 75.3 /100 | #158 | Good 8.6% |
| Shoshone | 74.6 /100 | #159 | Good 8.6% |
| Cree | 72.8 /100 | #160 | Good 8.6% |
| Albanians | 72.8 /100 | #161 | Good 8.6% |
| Immigrants | South America | 71.3 /100 | #162 | Good 8.6% |
| Immigrants | Guatemala | 68.4 /100 | #163 | Good 8.7% |
| Paraguayans | 62.2 /100 | #164 | Good 8.7% |
| Immigrants | Dominican Republic | 61.4 /100 | #165 | Good 8.7% |
| Immigrants | Belize | 57.6 /100 | #166 | Average 8.7% |
| Immigrants | Eastern Africa | 57.6 /100 | #167 | Average 8.7% |
| Immigrants | Lithuania | 57.2 /100 | #168 | Average 8.7% |