White/Caucasian vs Spaniard Unemployment Among Seniors over 75 years
COMPARE
White/Caucasian
Spaniard
Unemployment Among Seniors over 75 years
Unemployment Among Seniors over 75 years Comparison
Whites/Caucasians
Spaniards
10.1%
UNEMPLOYMENT AMONG SENIORS OVER 75 YEARS
0.0/ 100
METRIC RATING
308th/ 347
METRIC RANK
8.9%
UNEMPLOYMENT AMONG SENIORS OVER 75 YEARS
22.0/ 100
METRIC RATING
204th/ 347
METRIC RANK
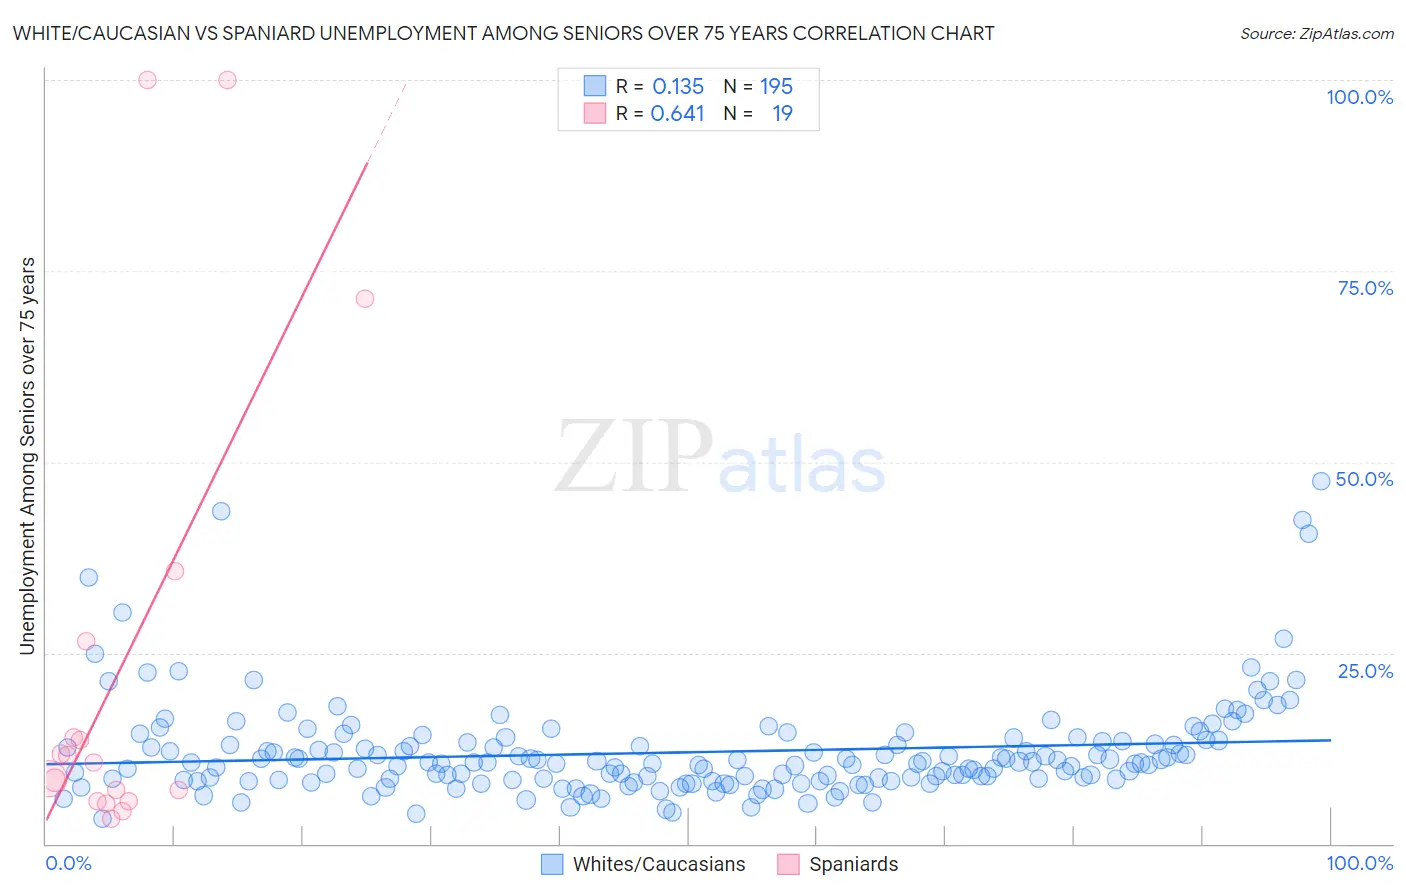
White/Caucasian vs Spaniard Unemployment Among Seniors over 75 years Correlation Chart
The statistical analysis conducted on geographies consisting of 235,408,651 people shows a poor positive correlation between the proportion of Whites/Caucasians and unemployment rate among seniors over the age of 75 in the United States with a correlation coefficient (R) of 0.135 and weighted average of 10.1%. Similarly, the statistical analysis conducted on geographies consisting of 214,427,527 people shows a significant positive correlation between the proportion of Spaniards and unemployment rate among seniors over the age of 75 in the United States with a correlation coefficient (R) of 0.641 and weighted average of 8.9%, a difference of 13.2%.
Unemployment Among Seniors over 75 years Correlation Summary
| Measurement | White/Caucasian | Spaniard |
| Minimum | 3.3% | 3.3% |
| Maximum | 47.4% | 100.0% |
| Range | 44.1% | 96.7% |
| Mean | 12.0% | 23.7% |
| Median | 10.6% | 10.6% |
| Interquartile 25% (IQ1) | 8.4% | 5.6% |
| Interquartile 75% (IQ3) | 13.4% | 26.5% |
| Interquartile Range (IQR) | 5.0% | 20.9% |
| Standard Deviation (Sample) | 6.5% | 31.2% |
| Standard Deviation (Population) | 6.5% | 30.4% |
Similar Demographics by Unemployment Among Seniors over 75 years
Demographics Similar to Whites/Caucasians by Unemployment Among Seniors over 75 years
In terms of unemployment among seniors over 75 years, the demographic groups most similar to Whites/Caucasians are English (10.1%, a difference of 0.070%), Hungarian (10.1%, a difference of 0.25%), Scottish (10.1%, a difference of 0.37%), Chippewa (10.1%, a difference of 0.38%), and Immigrants from Fiji (10.0%, a difference of 0.44%).
| Demographics | Rating | Rank | Unemployment Among Seniors over 75 years |
| Welsh | 0.0 /100 | #301 | Tragic 10.0% |
| Finns | 0.0 /100 | #302 | Tragic 10.0% |
| Puget Sound Salish | 0.0 /100 | #303 | Tragic 10.0% |
| Scotch-Irish | 0.0 /100 | #304 | Tragic 10.0% |
| Swedes | 0.0 /100 | #305 | Tragic 10.0% |
| Italians | 0.0 /100 | #306 | Tragic 10.0% |
| Immigrants | Fiji | 0.0 /100 | #307 | Tragic 10.0% |
| Whites/Caucasians | 0.0 /100 | #308 | Tragic 10.1% |
| English | 0.0 /100 | #309 | Tragic 10.1% |
| Hungarians | 0.0 /100 | #310 | Tragic 10.1% |
| Scottish | 0.0 /100 | #311 | Tragic 10.1% |
| Chippewa | 0.0 /100 | #312 | Tragic 10.1% |
| Nepalese | 0.0 /100 | #313 | Tragic 10.1% |
| Dutch West Indians | 0.0 /100 | #314 | Tragic 10.2% |
| Pennsylvania Germans | 0.0 /100 | #315 | Tragic 10.2% |
Demographics Similar to Spaniards by Unemployment Among Seniors over 75 years
In terms of unemployment among seniors over 75 years, the demographic groups most similar to Spaniards are Korean (8.9%, a difference of 0.010%), Immigrants from Northern Europe (8.9%, a difference of 0.14%), Russian (8.9%, a difference of 0.16%), Immigrants from Peru (8.9%, a difference of 0.17%), and Pakistani (8.9%, a difference of 0.25%).
| Demographics | Rating | Rank | Unemployment Among Seniors over 75 years |
| Immigrants | Laos | 26.3 /100 | #197 | Fair 8.9% |
| Eastern Europeans | 25.9 /100 | #198 | Fair 8.9% |
| Pakistanis | 25.4 /100 | #199 | Fair 8.9% |
| Osage | 25.4 /100 | #200 | Fair 8.9% |
| Immigrants | Peru | 24.3 /100 | #201 | Fair 8.9% |
| Russians | 24.1 /100 | #202 | Fair 8.9% |
| Immigrants | Northern Europe | 23.9 /100 | #203 | Fair 8.9% |
| Spaniards | 22.0 /100 | #204 | Fair 8.9% |
| Koreans | 21.9 /100 | #205 | Fair 8.9% |
| Immigrants | Western Europe | 18.2 /100 | #206 | Poor 8.9% |
| Malaysians | 16.3 /100 | #207 | Poor 8.9% |
| Immigrants | Philippines | 15.8 /100 | #208 | Poor 8.9% |
| Salvadorans | 15.4 /100 | #209 | Poor 8.9% |
| Bermudans | 15.0 /100 | #210 | Poor 8.9% |
| Delaware | 14.6 /100 | #211 | Poor 9.0% |