White/Caucasian vs Albanian Single Male Poverty
COMPARE
White/Caucasian
Albanian
Single Male Poverty
Single Male Poverty Comparison
Whites/Caucasians
Albanians
14.5%
SINGLE MALE POVERTY
0.0/ 100
METRIC RATING
288th/ 347
METRIC RANK
12.4%
SINGLE MALE POVERTY
90.6/ 100
METRIC RATING
118th/ 347
METRIC RANK
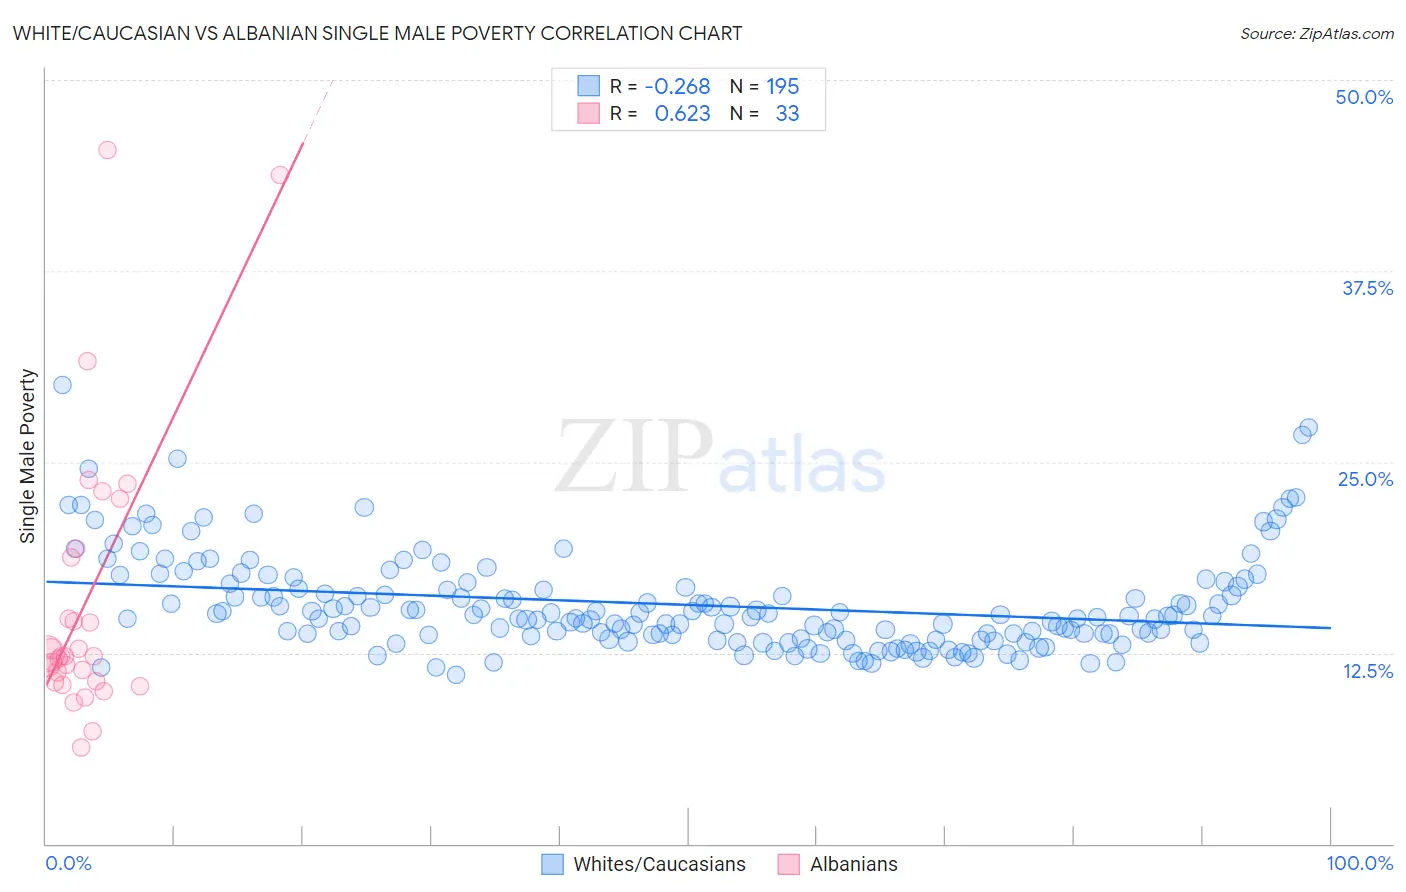
White/Caucasian vs Albanian Single Male Poverty Correlation Chart
The statistical analysis conducted on geographies consisting of 478,066,159 people shows a weak negative correlation between the proportion of Whites/Caucasians and poverty level among single males in the United States with a correlation coefficient (R) of -0.268 and weighted average of 14.5%. Similarly, the statistical analysis conducted on geographies consisting of 175,584,305 people shows a significant positive correlation between the proportion of Albanians and poverty level among single males in the United States with a correlation coefficient (R) of 0.623 and weighted average of 12.4%, a difference of 16.7%.
Single Male Poverty Correlation Summary
| Measurement | White/Caucasian | Albanian |
| Minimum | 11.1% | 6.3% |
| Maximum | 30.0% | 45.5% |
| Range | 19.0% | 39.1% |
| Mean | 15.6% | 15.9% |
| Median | 14.8% | 12.3% |
| Interquartile 25% (IQ1) | 13.6% | 10.6% |
| Interquartile 75% (IQ3) | 16.8% | 19.0% |
| Interquartile Range (IQR) | 3.2% | 8.4% |
| Standard Deviation (Sample) | 3.2% | 9.2% |
| Standard Deviation (Population) | 3.2% | 9.1% |
Similar Demographics by Single Male Poverty
Demographics Similar to Whites/Caucasians by Single Male Poverty
In terms of single male poverty, the demographic groups most similar to Whites/Caucasians are Iroquois (14.5%, a difference of 0.0%), Immigrants from Dominica (14.5%, a difference of 0.090%), Celtic (14.5%, a difference of 0.13%), U.S. Virgin Islander (14.5%, a difference of 0.31%), and French (14.4%, a difference of 0.45%).
| Demographics | Rating | Rank | Single Male Poverty |
| Hispanics or Latinos | 0.0 /100 | #281 | Tragic 14.2% |
| Spanish Americans | 0.0 /100 | #282 | Tragic 14.2% |
| Yaqui | 0.0 /100 | #283 | Tragic 14.2% |
| Immigrants | Bahamas | 0.0 /100 | #284 | Tragic 14.4% |
| French | 0.0 /100 | #285 | Tragic 14.4% |
| Celtics | 0.0 /100 | #286 | Tragic 14.5% |
| Iroquois | 0.0 /100 | #287 | Tragic 14.5% |
| Whites/Caucasians | 0.0 /100 | #288 | Tragic 14.5% |
| Immigrants | Dominica | 0.0 /100 | #289 | Tragic 14.5% |
| U.S. Virgin Islanders | 0.0 /100 | #290 | Tragic 14.5% |
| Bahamians | 0.0 /100 | #291 | Tragic 14.6% |
| Immigrants | Nonimmigrants | 0.0 /100 | #292 | Tragic 14.6% |
| French Canadians | 0.0 /100 | #293 | Tragic 14.6% |
| Ottawa | 0.0 /100 | #294 | Tragic 14.6% |
| Scotch-Irish | 0.0 /100 | #295 | Tragic 14.7% |
Demographics Similar to Albanians by Single Male Poverty
In terms of single male poverty, the demographic groups most similar to Albanians are Immigrants from Albania (12.4%, a difference of 0.030%), Immigrants from Oceania (12.4%, a difference of 0.10%), Immigrants from Syria (12.4%, a difference of 0.11%), Immigrants from Southern Europe (12.4%, a difference of 0.16%), and Venezuelan (12.4%, a difference of 0.17%).
| Demographics | Rating | Rank | Single Male Poverty |
| Immigrants | North Macedonia | 93.6 /100 | #111 | Exceptional 12.3% |
| Kenyans | 93.3 /100 | #112 | Exceptional 12.4% |
| Pakistanis | 92.4 /100 | #113 | Exceptional 12.4% |
| Nicaraguans | 92.1 /100 | #114 | Exceptional 12.4% |
| Immigrants | Southern Europe | 91.5 /100 | #115 | Exceptional 12.4% |
| Immigrants | Syria | 91.2 /100 | #116 | Exceptional 12.4% |
| Immigrants | Oceania | 91.1 /100 | #117 | Exceptional 12.4% |
| Albanians | 90.6 /100 | #118 | Exceptional 12.4% |
| Immigrants | Albania | 90.3 /100 | #119 | Exceptional 12.4% |
| Venezuelans | 89.4 /100 | #120 | Excellent 12.4% |
| Icelanders | 88.2 /100 | #121 | Excellent 12.5% |
| Serbians | 87.9 /100 | #122 | Excellent 12.5% |
| Immigrants | Kenya | 87.6 /100 | #123 | Excellent 12.5% |
| Russians | 87.3 /100 | #124 | Excellent 12.5% |
| Immigrants | Jordan | 87.1 /100 | #125 | Excellent 12.5% |