White/Caucasian vs Immigrants from Dominica Unemployment Among Seniors over 75 years
COMPARE
White/Caucasian
Immigrants from Dominica
Unemployment Among Seniors over 75 years
Unemployment Among Seniors over 75 years Comparison
Whites/Caucasians
Immigrants from Dominica
10.1%
UNEMPLOYMENT AMONG SENIORS OVER 75 YEARS
0.0/ 100
METRIC RATING
308th/ 347
METRIC RANK
9.8%
UNEMPLOYMENT AMONG SENIORS OVER 75 YEARS
0.0/ 100
METRIC RATING
294th/ 347
METRIC RANK
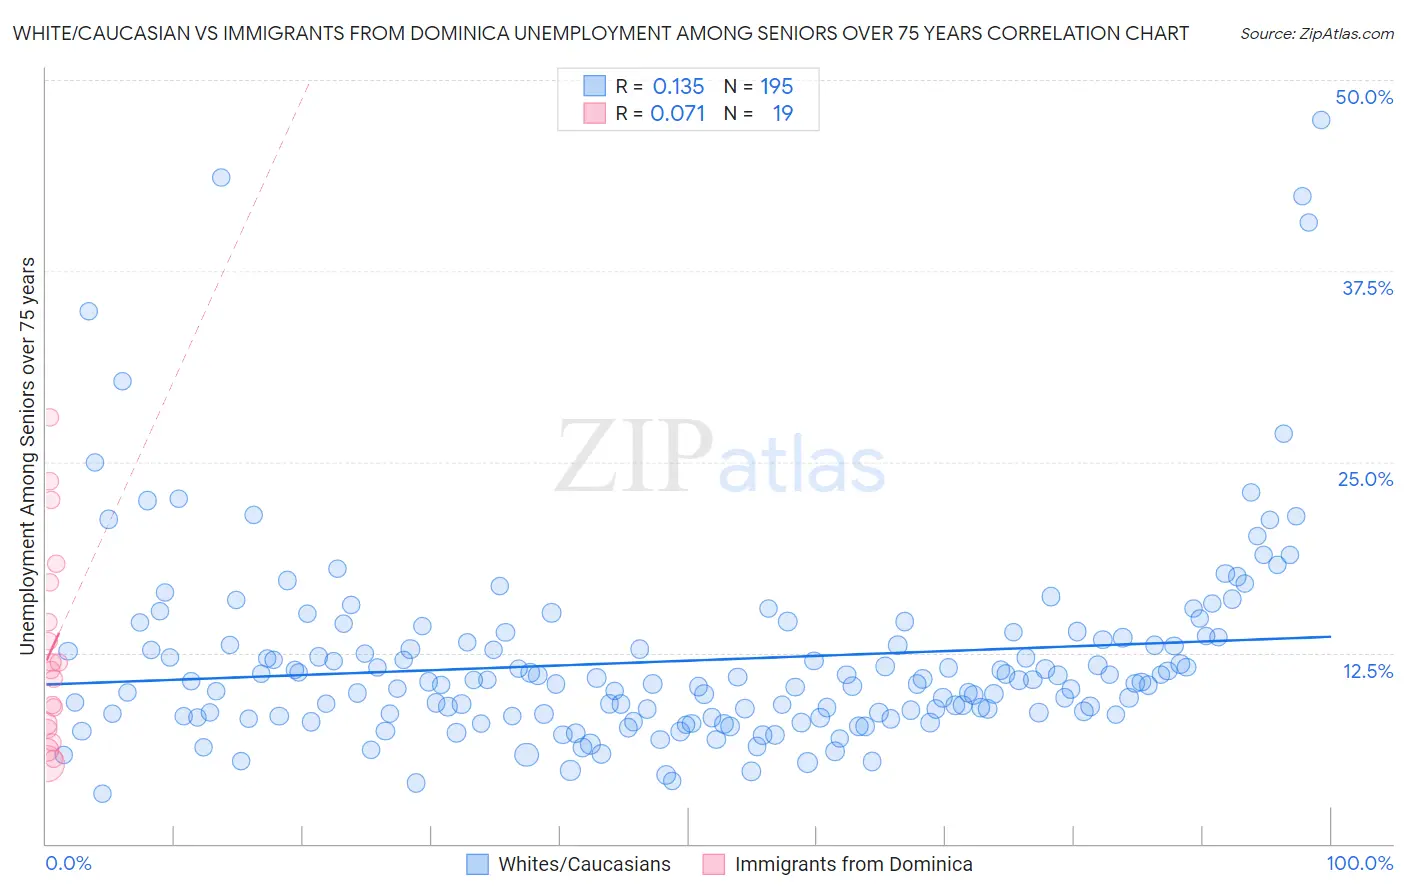
White/Caucasian vs Immigrants from Dominica Unemployment Among Seniors over 75 years Correlation Chart
The statistical analysis conducted on geographies consisting of 235,408,651 people shows a poor positive correlation between the proportion of Whites/Caucasians and unemployment rate among seniors over the age of 75 in the United States with a correlation coefficient (R) of 0.135 and weighted average of 10.1%. Similarly, the statistical analysis conducted on geographies consisting of 63,250,928 people shows a slight positive correlation between the proportion of Immigrants from Dominica and unemployment rate among seniors over the age of 75 in the United States with a correlation coefficient (R) of 0.071 and weighted average of 9.8%, a difference of 2.7%.
Unemployment Among Seniors over 75 years Correlation Summary
| Measurement | White/Caucasian | Immigrants from Dominica |
| Minimum | 3.3% | 5.3% |
| Maximum | 47.4% | 27.9% |
| Range | 44.1% | 22.7% |
| Mean | 12.0% | 12.7% |
| Median | 10.6% | 11.4% |
| Interquartile 25% (IQ1) | 8.4% | 7.5% |
| Interquartile 75% (IQ3) | 13.4% | 17.1% |
| Interquartile Range (IQR) | 5.0% | 9.6% |
| Standard Deviation (Sample) | 6.5% | 6.6% |
| Standard Deviation (Population) | 6.5% | 6.4% |
Demographics Similar to Whites/Caucasians and Immigrants from Dominica by Unemployment Among Seniors over 75 years
In terms of unemployment among seniors over 75 years, the demographic groups most similar to Whites/Caucasians are English (10.1%, a difference of 0.070%), Hungarian (10.1%, a difference of 0.25%), Scottish (10.1%, a difference of 0.37%), Immigrants from Fiji (10.0%, a difference of 0.44%), and Italian (10.0%, a difference of 0.56%). Similarly, the demographic groups most similar to Immigrants from Dominica are Norwegian (9.8%, a difference of 0.060%), Immigrants from Western Africa (9.8%, a difference of 0.23%), Nonimmigrants (9.8%, a difference of 0.36%), Immigrants from St. Vincent and the Grenadines (9.8%, a difference of 0.41%), and Cherokee (9.8%, a difference of 0.50%).
| Demographics | Rating | Rank | Unemployment Among Seniors over 75 years |
| Scandinavians | 0.0 /100 | #291 | Tragic 9.7% |
| Immigrants | Western Africa | 0.0 /100 | #292 | Tragic 9.8% |
| Norwegians | 0.0 /100 | #293 | Tragic 9.8% |
| Immigrants | Dominica | 0.0 /100 | #294 | Tragic 9.8% |
| Immigrants | Nonimmigrants | 0.0 /100 | #295 | Tragic 9.8% |
| Immigrants | St. Vincent and the Grenadines | 0.0 /100 | #296 | Tragic 9.8% |
| Cherokee | 0.0 /100 | #297 | Tragic 9.8% |
| Lithuanians | 0.0 /100 | #298 | Tragic 9.9% |
| Belgians | 0.0 /100 | #299 | Tragic 9.9% |
| Iraqis | 0.0 /100 | #300 | Tragic 9.9% |
| Welsh | 0.0 /100 | #301 | Tragic 10.0% |
| Finns | 0.0 /100 | #302 | Tragic 10.0% |
| Puget Sound Salish | 0.0 /100 | #303 | Tragic 10.0% |
| Scotch-Irish | 0.0 /100 | #304 | Tragic 10.0% |
| Swedes | 0.0 /100 | #305 | Tragic 10.0% |
| Italians | 0.0 /100 | #306 | Tragic 10.0% |
| Immigrants | Fiji | 0.0 /100 | #307 | Tragic 10.0% |
| Whites/Caucasians | 0.0 /100 | #308 | Tragic 10.1% |
| English | 0.0 /100 | #309 | Tragic 10.1% |
| Hungarians | 0.0 /100 | #310 | Tragic 10.1% |
| Scottish | 0.0 /100 | #311 | Tragic 10.1% |