White/Caucasian vs Albanian Female Poverty Among 25-34 Year Olds
COMPARE
White/Caucasian
Albanian
Female Poverty Among 25-34 Year Olds
Female Poverty Among 25-34 Year Olds Comparison
Whites/Caucasians
Albanians
14.7%
FEMALE POVERTY AMONG 25-34 YEAR OLDS
1.8/ 100
METRIC RATING
233rd/ 347
METRIC RANK
12.5%
FEMALE POVERTY AMONG 25-34 YEAR OLDS
97.7/ 100
METRIC RATING
83rd/ 347
METRIC RANK
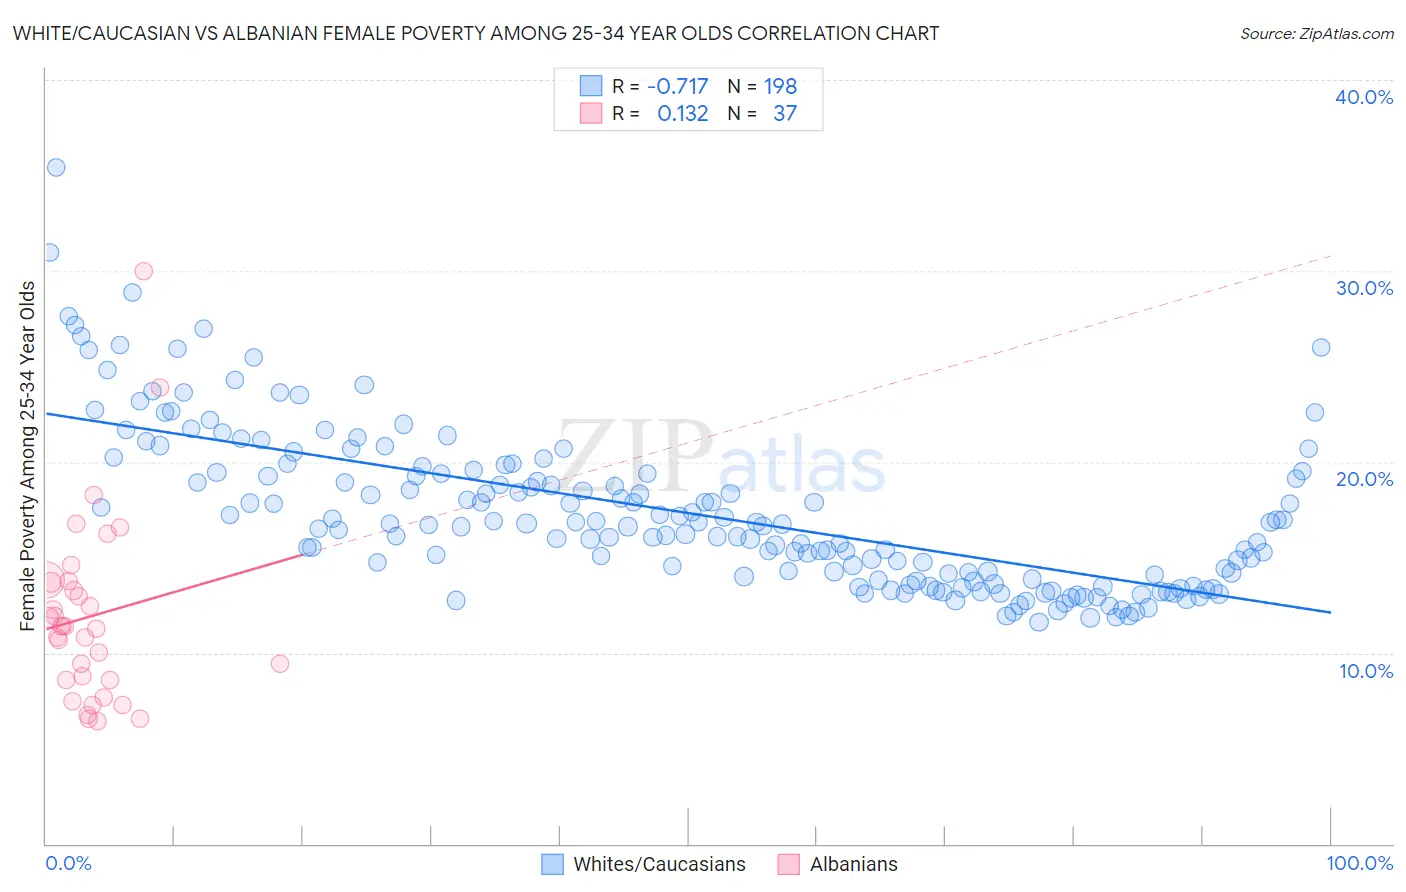
White/Caucasian vs Albanian Female Poverty Among 25-34 Year Olds Correlation Chart
The statistical analysis conducted on geographies consisting of 558,401,986 people shows a strong negative correlation between the proportion of Whites/Caucasians and poverty level among females between the ages 25 and 34 in the United States with a correlation coefficient (R) of -0.717 and weighted average of 14.7%. Similarly, the statistical analysis conducted on geographies consisting of 191,036,694 people shows a poor positive correlation between the proportion of Albanians and poverty level among females between the ages 25 and 34 in the United States with a correlation coefficient (R) of 0.132 and weighted average of 12.5%, a difference of 17.5%.
Female Poverty Among 25-34 Year Olds Correlation Summary
| Measurement | White/Caucasian | Albanian |
| Minimum | 11.6% | 6.4% |
| Maximum | 35.4% | 30.0% |
| Range | 23.8% | 23.6% |
| Mean | 17.3% | 11.9% |
| Median | 16.7% | 11.4% |
| Interquartile 25% (IQ1) | 13.9% | 8.6% |
| Interquartile 75% (IQ3) | 19.4% | 13.7% |
| Interquartile Range (IQR) | 5.6% | 5.1% |
| Standard Deviation (Sample) | 4.2% | 4.8% |
| Standard Deviation (Population) | 4.2% | 4.8% |
Similar Demographics by Female Poverty Among 25-34 Year Olds
Demographics Similar to Whites/Caucasians by Female Poverty Among 25-34 Year Olds
In terms of female poverty among 25-34 year olds, the demographic groups most similar to Whites/Caucasians are Immigrants from Ecuador (14.6%, a difference of 0.18%), Cuban (14.7%, a difference of 0.23%), Immigrants from Jamaica (14.7%, a difference of 0.41%), Salvadoran (14.7%, a difference of 0.43%), and Immigrants from Ghana (14.7%, a difference of 0.43%).
| Demographics | Rating | Rank | Female Poverty Among 25-34 Year Olds |
| Nicaraguans | 3.3 /100 | #226 | Tragic 14.5% |
| Celtics | 2.8 /100 | #227 | Tragic 14.5% |
| Vietnamese | 2.6 /100 | #228 | Tragic 14.6% |
| Spanish | 2.5 /100 | #229 | Tragic 14.6% |
| Spaniards | 2.3 /100 | #230 | Tragic 14.6% |
| Delaware | 2.3 /100 | #231 | Tragic 14.6% |
| Immigrants | Ecuador | 1.9 /100 | #232 | Tragic 14.6% |
| Whites/Caucasians | 1.8 /100 | #233 | Tragic 14.7% |
| Cubans | 1.6 /100 | #234 | Tragic 14.7% |
| Immigrants | Jamaica | 1.4 /100 | #235 | Tragic 14.7% |
| Salvadorans | 1.4 /100 | #236 | Tragic 14.7% |
| Immigrants | Ghana | 1.4 /100 | #237 | Tragic 14.7% |
| Alsatians | 1.4 /100 | #238 | Tragic 14.7% |
| Malaysians | 1.4 /100 | #239 | Tragic 14.7% |
| Immigrants | Grenada | 1.3 /100 | #240 | Tragic 14.7% |
Demographics Similar to Albanians by Female Poverty Among 25-34 Year Olds
In terms of female poverty among 25-34 year olds, the demographic groups most similar to Albanians are Immigrants from Latvia (12.5%, a difference of 0.060%), Immigrants from South Eastern Asia (12.5%, a difference of 0.17%), Croatian (12.5%, a difference of 0.18%), Argentinean (12.5%, a difference of 0.21%), and Immigrants from Austria (12.5%, a difference of 0.28%).
| Demographics | Rating | Rank | Female Poverty Among 25-34 Year Olds |
| Greeks | 98.9 /100 | #76 | Exceptional 12.3% |
| Immigrants | Italy | 98.8 /100 | #77 | Exceptional 12.3% |
| Immigrants | Ukraine | 98.6 /100 | #78 | Exceptional 12.3% |
| Immigrants | Jordan | 98.5 /100 | #79 | Exceptional 12.4% |
| Immigrants | Malaysia | 98.3 /100 | #80 | Exceptional 12.4% |
| Immigrants | Kazakhstan | 98.1 /100 | #81 | Exceptional 12.4% |
| Ethiopians | 98.0 /100 | #82 | Exceptional 12.4% |
| Albanians | 97.7 /100 | #83 | Exceptional 12.5% |
| Immigrants | Latvia | 97.7 /100 | #84 | Exceptional 12.5% |
| Immigrants | South Eastern Asia | 97.6 /100 | #85 | Exceptional 12.5% |
| Croatians | 97.5 /100 | #86 | Exceptional 12.5% |
| Argentineans | 97.5 /100 | #87 | Exceptional 12.5% |
| Immigrants | Austria | 97.4 /100 | #88 | Exceptional 12.5% |
| Italians | 97.2 /100 | #89 | Exceptional 12.5% |
| Immigrants | Albania | 97.1 /100 | #90 | Exceptional 12.5% |