Nonimmigrants vs Scottish Unemployment
COMPARE
Nonimmigrants
Scottish
Unemployment
Unemployment Comparison
Nonimmigrants
Scottish
5.3%
UNEMPLOYMENT
47.9/ 100
METRIC RATING
177th/ 347
METRIC RANK
4.7%
UNEMPLOYMENT
99.9/ 100
METRIC RATING
19th/ 347
METRIC RANK
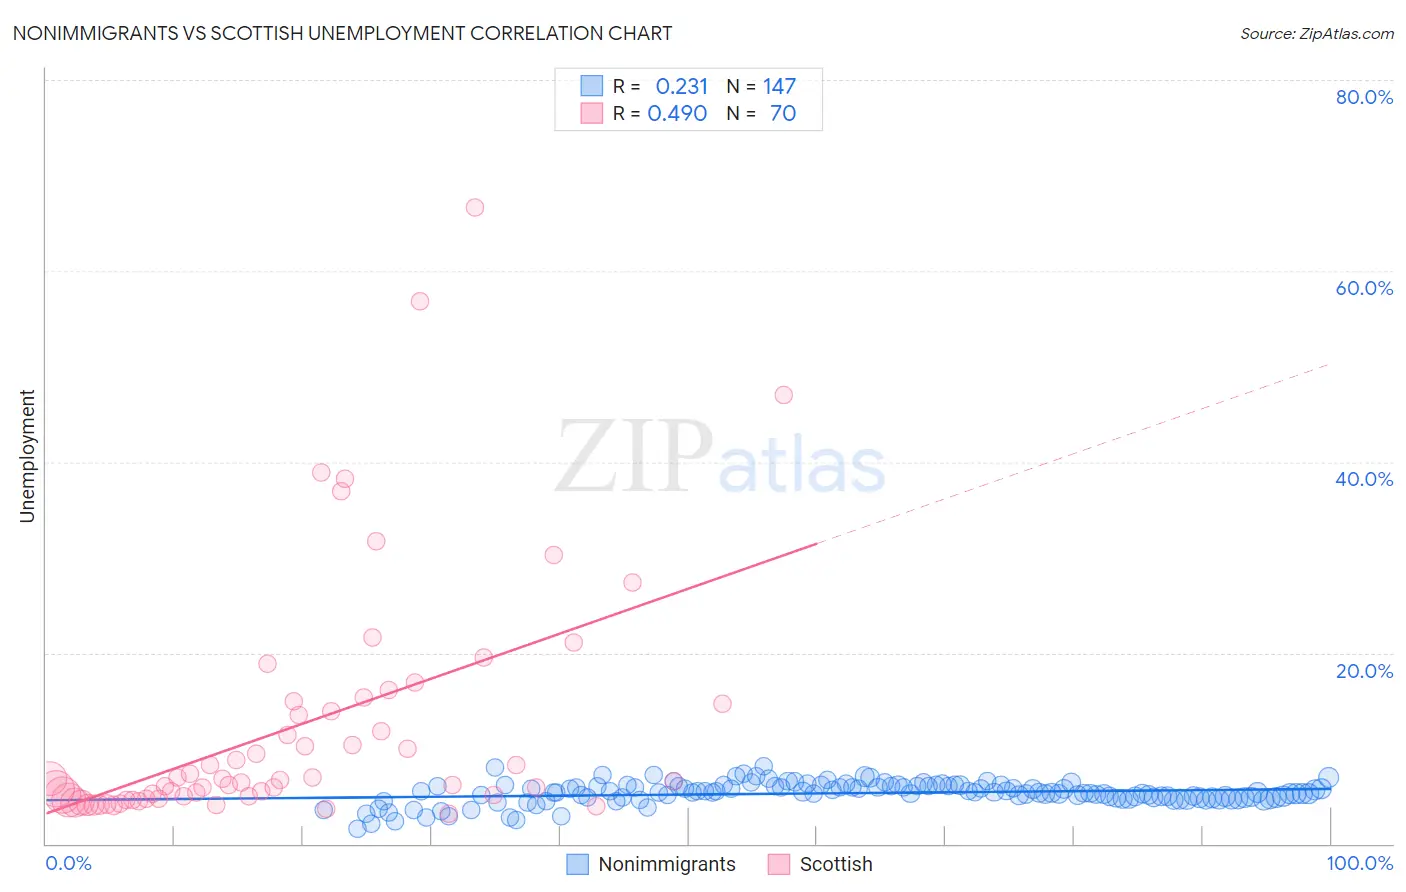
Nonimmigrants vs Scottish Unemployment Correlation Chart
The statistical analysis conducted on geographies consisting of 578,965,270 people shows a weak positive correlation between the proportion of Nonimmigrants and unemployment in the United States with a correlation coefficient (R) of 0.231 and weighted average of 5.3%. Similarly, the statistical analysis conducted on geographies consisting of 563,082,415 people shows a moderate positive correlation between the proportion of Scottish and unemployment in the United States with a correlation coefficient (R) of 0.490 and weighted average of 4.7%, a difference of 12.9%.
Unemployment Correlation Summary
| Measurement | Nonimmigrants | Scottish |
| Minimum | 1.6% | 3.2% |
| Maximum | 8.1% | 66.7% |
| Range | 6.5% | 63.5% |
| Mean | 5.3% | 12.3% |
| Median | 5.4% | 6.6% |
| Interquartile 25% (IQ1) | 4.8% | 4.8% |
| Interquartile 75% (IQ3) | 6.0% | 14.7% |
| Interquartile Range (IQR) | 1.2% | 9.9% |
| Standard Deviation (Sample) | 1.1% | 12.9% |
| Standard Deviation (Population) | 1.1% | 12.8% |
Similar Demographics by Unemployment
Demographics Similar to Nonimmigrants by Unemployment
In terms of unemployment, the demographic groups most similar to Nonimmigrants are Afghan (5.3%, a difference of 0.030%), Nicaraguan (5.3%, a difference of 0.050%), Malaysian (5.3%, a difference of 0.060%), Taiwanese (5.3%, a difference of 0.11%), and Immigrants from Congo (5.3%, a difference of 0.13%).
| Demographics | Rating | Rank | Unemployment |
| Immigrants | Nicaragua | 57.1 /100 | #170 | Average 5.2% |
| Puget Sound Salish | 56.6 /100 | #171 | Average 5.2% |
| Immigrants | Vietnam | 52.5 /100 | #172 | Average 5.2% |
| Immigrants | Poland | 51.8 /100 | #173 | Average 5.3% |
| Immigrants | Congo | 50.0 /100 | #174 | Average 5.3% |
| Taiwanese | 49.6 /100 | #175 | Average 5.3% |
| Nicaraguans | 48.7 /100 | #176 | Average 5.3% |
| Immigrants | Nonimmigrants | 47.9 /100 | #177 | Average 5.3% |
| Afghans | 47.4 /100 | #178 | Average 5.3% |
| Malaysians | 46.8 /100 | #179 | Average 5.3% |
| Immigrants | Greece | 45.0 /100 | #180 | Average 5.3% |
| Albanians | 43.5 /100 | #181 | Average 5.3% |
| Spaniards | 42.2 /100 | #182 | Average 5.3% |
| Brazilians | 40.2 /100 | #183 | Average 5.3% |
| Assyrians/Chaldeans/Syriacs | 39.2 /100 | #184 | Fair 5.3% |
Demographics Similar to Scottish by Unemployment
In terms of unemployment, the demographic groups most similar to Scottish are Immigrants from Venezuela (4.7%, a difference of 0.080%), Slovene (4.7%, a difference of 0.10%), Chinese (4.7%, a difference of 0.21%), European (4.6%, a difference of 0.35%), and Carpatho Rusyn (4.7%, a difference of 0.59%).
| Demographics | Rating | Rank | Unemployment |
| Pennsylvania Germans | 100.0 /100 | #12 | Exceptional 4.6% |
| Belgians | 100.0 /100 | #13 | Exceptional 4.6% |
| Immigrants | Cuba | 100.0 /100 | #14 | Exceptional 4.6% |
| Europeans | 99.9 /100 | #15 | Exceptional 4.6% |
| Chinese | 99.9 /100 | #16 | Exceptional 4.7% |
| Slovenes | 99.9 /100 | #17 | Exceptional 4.7% |
| Immigrants | Venezuela | 99.9 /100 | #18 | Exceptional 4.7% |
| Scottish | 99.9 /100 | #19 | Exceptional 4.7% |
| Carpatho Rusyns | 99.9 /100 | #20 | Exceptional 4.7% |
| Welsh | 99.9 /100 | #21 | Exceptional 4.7% |
| Thais | 99.9 /100 | #22 | Exceptional 4.7% |
| British | 99.9 /100 | #23 | Exceptional 4.7% |
| Venezuelans | 99.9 /100 | #24 | Exceptional 4.7% |
| Latvians | 99.9 /100 | #25 | Exceptional 4.7% |
| Bulgarians | 99.9 /100 | #26 | Exceptional 4.7% |