Latvian vs Scottish Unemployment
COMPARE
Latvian
Scottish
Unemployment
Unemployment Comparison
Latvians
Scottish
4.7%
UNEMPLOYMENT
99.9/ 100
METRIC RATING
25th/ 347
METRIC RANK
4.7%
UNEMPLOYMENT
99.9/ 100
METRIC RATING
19th/ 347
METRIC RANK
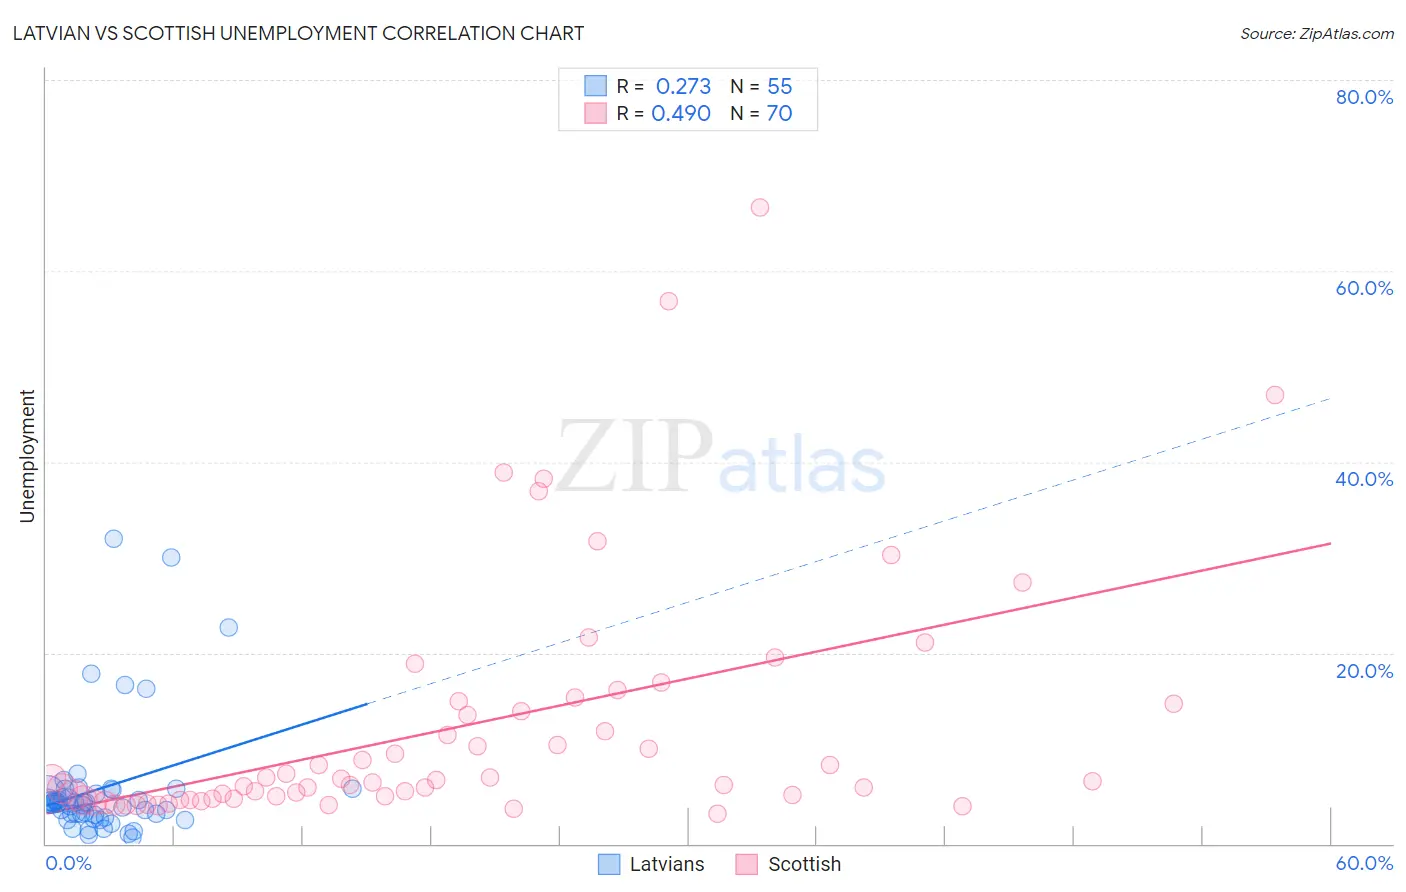
Latvian vs Scottish Unemployment Correlation Chart
The statistical analysis conducted on geographies consisting of 220,638,236 people shows a weak positive correlation between the proportion of Latvians and unemployment in the United States with a correlation coefficient (R) of 0.273 and weighted average of 4.7%. Similarly, the statistical analysis conducted on geographies consisting of 563,082,415 people shows a moderate positive correlation between the proportion of Scottish and unemployment in the United States with a correlation coefficient (R) of 0.490 and weighted average of 4.7%, a difference of 1.1%.
Unemployment Correlation Summary
| Measurement | Latvian | Scottish |
| Minimum | 0.70% | 3.2% |
| Maximum | 32.0% | 66.7% |
| Range | 31.3% | 63.5% |
| Mean | 5.9% | 12.3% |
| Median | 4.3% | 6.6% |
| Interquartile 25% (IQ1) | 3.0% | 4.8% |
| Interquartile 75% (IQ3) | 5.6% | 14.7% |
| Interquartile Range (IQR) | 2.6% | 9.9% |
| Standard Deviation (Sample) | 6.4% | 12.9% |
| Standard Deviation (Population) | 6.4% | 12.8% |
Demographics Similar to Latvians and Scottish by Unemployment
In terms of unemployment, the demographic groups most similar to Latvians are Bulgarian (4.7%, a difference of 0.040%), Venezuelan (4.7%, a difference of 0.070%), British (4.7%, a difference of 0.15%), Finnish (4.7%, a difference of 0.25%), and Welsh (4.7%, a difference of 0.45%). Similarly, the demographic groups most similar to Scottish are Immigrants from Venezuela (4.7%, a difference of 0.080%), Slovene (4.7%, a difference of 0.10%), Chinese (4.7%, a difference of 0.21%), European (4.6%, a difference of 0.35%), and Carpatho Rusyn (4.7%, a difference of 0.59%).
| Demographics | Rating | Rank | Unemployment |
| Pennsylvania Germans | 100.0 /100 | #12 | Exceptional 4.6% |
| Belgians | 100.0 /100 | #13 | Exceptional 4.6% |
| Immigrants | Cuba | 100.0 /100 | #14 | Exceptional 4.6% |
| Europeans | 99.9 /100 | #15 | Exceptional 4.6% |
| Chinese | 99.9 /100 | #16 | Exceptional 4.7% |
| Slovenes | 99.9 /100 | #17 | Exceptional 4.7% |
| Immigrants | Venezuela | 99.9 /100 | #18 | Exceptional 4.7% |
| Scottish | 99.9 /100 | #19 | Exceptional 4.7% |
| Carpatho Rusyns | 99.9 /100 | #20 | Exceptional 4.7% |
| Welsh | 99.9 /100 | #21 | Exceptional 4.7% |
| Thais | 99.9 /100 | #22 | Exceptional 4.7% |
| British | 99.9 /100 | #23 | Exceptional 4.7% |
| Venezuelans | 99.9 /100 | #24 | Exceptional 4.7% |
| Latvians | 99.9 /100 | #25 | Exceptional 4.7% |
| Bulgarians | 99.9 /100 | #26 | Exceptional 4.7% |
| Finns | 99.9 /100 | #27 | Exceptional 4.7% |
| Cubans | 99.8 /100 | #28 | Exceptional 4.7% |
| Poles | 99.8 /100 | #29 | Exceptional 4.7% |
| Irish | 99.8 /100 | #30 | Exceptional 4.8% |
| Croatians | 99.8 /100 | #31 | Exceptional 4.8% |
| Zimbabweans | 99.8 /100 | #32 | Exceptional 4.8% |