Tohono O'odham vs Subsaharan African Unemployment Among Women with Children Ages 6 to 17 years
COMPARE
Tohono O'odham
Subsaharan African
Unemployment Among Women with Children Ages 6 to 17 years
Unemployment Among Women with Children Ages 6 to 17 years Comparison
Tohono O'odham
Sub-Saharan Africans
10.7%
UNEMPLOYMENT AMONG WOMEN WITH CHILDREN AGES 6 TO 17 YEARS
0.0/ 100
METRIC RATING
321st/ 347
METRIC RANK
10.0%
UNEMPLOYMENT AMONG WOMEN WITH CHILDREN AGES 6 TO 17 YEARS
0.0/ 100
METRIC RATING
290th/ 347
METRIC RANK
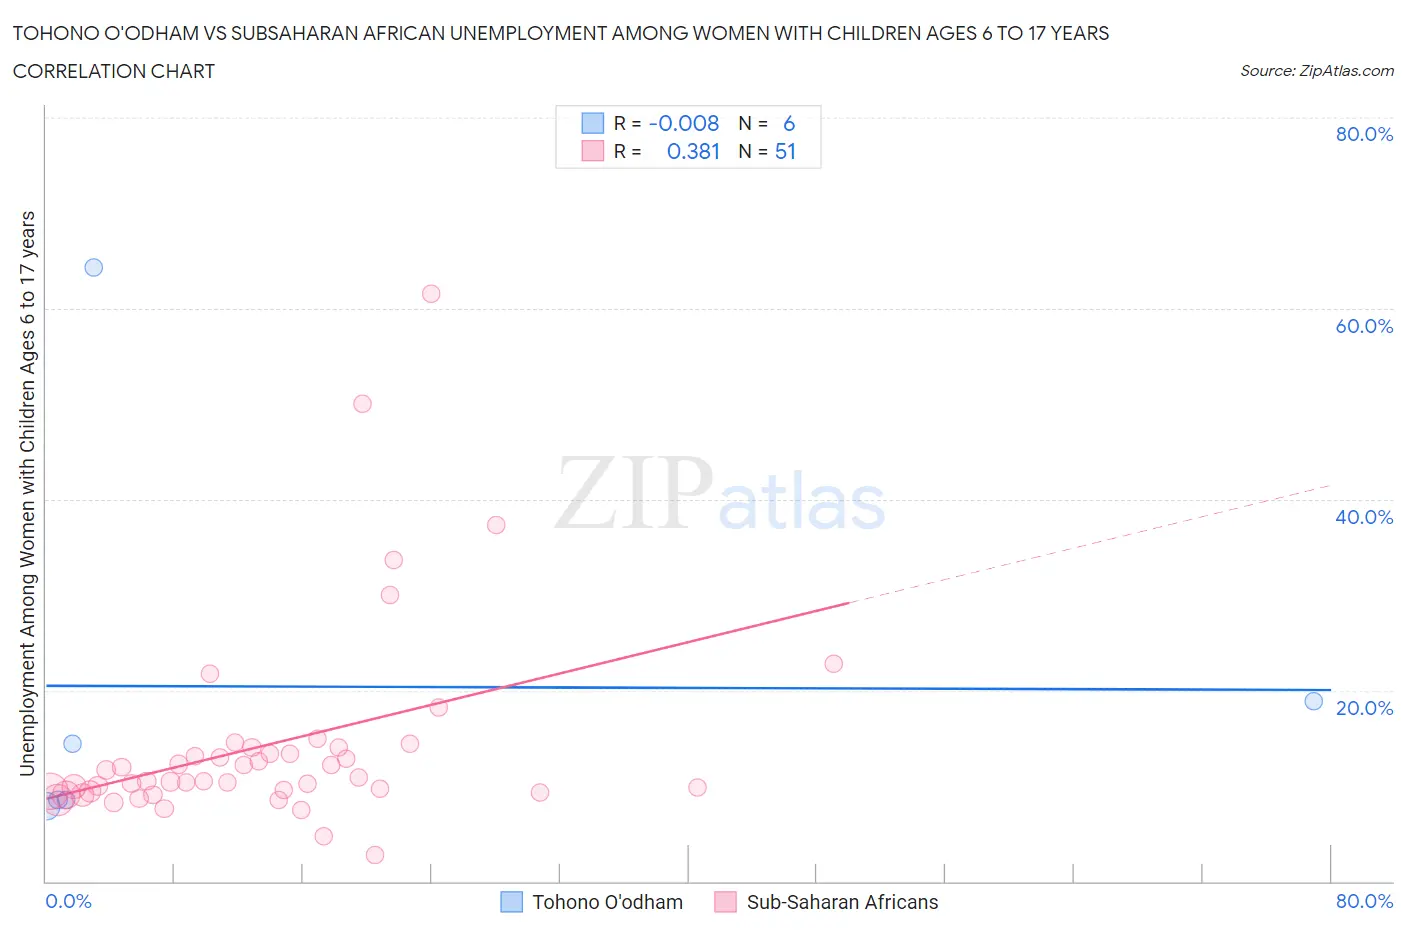
Tohono O'odham vs Subsaharan African Unemployment Among Women with Children Ages 6 to 17 years Correlation Chart
The statistical analysis conducted on geographies consisting of 54,737,899 people shows no correlation between the proportion of Tohono O'odham and unemployment rate among women with children between the ages 6 and 17 in the United States with a correlation coefficient (R) of -0.008 and weighted average of 10.7%. Similarly, the statistical analysis conducted on geographies consisting of 345,149,119 people shows a mild positive correlation between the proportion of Sub-Saharan Africans and unemployment rate among women with children between the ages 6 and 17 in the United States with a correlation coefficient (R) of 0.381 and weighted average of 10.0%, a difference of 6.7%.
Unemployment Among Women with Children Ages 6 to 17 years Correlation Summary
| Measurement | Tohono O'odham | Subsaharan African |
| Minimum | 7.8% | 2.8% |
| Maximum | 64.3% | 61.5% |
| Range | 56.5% | 58.7% |
| Mean | 20.4% | 14.3% |
| Median | 11.5% | 10.5% |
| Interquartile 25% (IQ1) | 8.5% | 9.4% |
| Interquartile 75% (IQ3) | 18.8% | 14.0% |
| Interquartile Range (IQR) | 10.3% | 4.6% |
| Standard Deviation (Sample) | 21.9% | 10.6% |
| Standard Deviation (Population) | 20.0% | 10.5% |
Similar Demographics by Unemployment Among Women with Children Ages 6 to 17 years
Demographics Similar to Tohono O'odham by Unemployment Among Women with Children Ages 6 to 17 years
In terms of unemployment among women with children ages 6 to 17 years, the demographic groups most similar to Tohono O'odham are Apache (10.7%, a difference of 0.17%), Immigrants from Uganda (10.7%, a difference of 0.19%), Cree (10.8%, a difference of 1.3%), Dominican (10.8%, a difference of 1.3%), and Immigrants from Dominican Republic (10.8%, a difference of 1.4%).
| Demographics | Rating | Rank | Unemployment Among Women with Children Ages 6 to 17 years |
| Immigrants | Cabo Verde | 0.0 /100 | #314 | Tragic 10.4% |
| Bahamians | 0.0 /100 | #315 | Tragic 10.4% |
| Immigrants | Dominica | 0.0 /100 | #316 | Tragic 10.5% |
| Bermudans | 0.0 /100 | #317 | Tragic 10.5% |
| Delaware | 0.0 /100 | #318 | Tragic 10.5% |
| Immigrants | Uganda | 0.0 /100 | #319 | Tragic 10.7% |
| Apache | 0.0 /100 | #320 | Tragic 10.7% |
| Tohono O'odham | 0.0 /100 | #321 | Tragic 10.7% |
| Cree | 0.0 /100 | #322 | Tragic 10.8% |
| Dominicans | 0.0 /100 | #323 | Tragic 10.8% |
| Immigrants | Dominican Republic | 0.0 /100 | #324 | Tragic 10.8% |
| Cajuns | 0.0 /100 | #325 | Tragic 10.8% |
| Liberians | 0.0 /100 | #326 | Tragic 10.8% |
| Cape Verdeans | 0.0 /100 | #327 | Tragic 10.9% |
| Ottawa | 0.0 /100 | #328 | Tragic 10.9% |
Demographics Similar to Sub-Saharan Africans by Unemployment Among Women with Children Ages 6 to 17 years
In terms of unemployment among women with children ages 6 to 17 years, the demographic groups most similar to Sub-Saharan Africans are Honduran (10.0%, a difference of 0.010%), Nonimmigrants (10.0%, a difference of 0.020%), Carpatho Rusyn (10.0%, a difference of 0.030%), Haitian (10.0%, a difference of 0.12%), and Ecuadorian (10.0%, a difference of 0.22%).
| Demographics | Rating | Rank | Unemployment Among Women with Children Ages 6 to 17 years |
| Central American Indians | 0.0 /100 | #283 | Tragic 9.9% |
| Yakama | 0.0 /100 | #284 | Tragic 9.9% |
| Hispanics or Latinos | 0.0 /100 | #285 | Tragic 9.9% |
| Choctaw | 0.0 /100 | #286 | Tragic 9.9% |
| Sierra Leoneans | 0.0 /100 | #287 | Tragic 9.9% |
| Shoshone | 0.0 /100 | #288 | Tragic 10.0% |
| Hondurans | 0.0 /100 | #289 | Tragic 10.0% |
| Sub-Saharan Africans | 0.0 /100 | #290 | Tragic 10.0% |
| Immigrants | Nonimmigrants | 0.0 /100 | #291 | Tragic 10.0% |
| Carpatho Rusyns | 0.0 /100 | #292 | Tragic 10.0% |
| Haitians | 0.0 /100 | #293 | Tragic 10.0% |
| Ecuadorians | 0.0 /100 | #294 | Tragic 10.0% |
| Cherokee | 0.0 /100 | #295 | Tragic 10.0% |
| Immigrants | Western Africa | 0.0 /100 | #296 | Tragic 10.1% |
| Immigrants | Caribbean | 0.0 /100 | #297 | Tragic 10.1% |