Ugandan vs Subsaharan African Unemployment Among Women with Children Ages 6 to 17 years
COMPARE
Ugandan
Subsaharan African
Unemployment Among Women with Children Ages 6 to 17 years
Unemployment Among Women with Children Ages 6 to 17 years Comparison
Ugandans
Sub-Saharan Africans
12.0%
UNEMPLOYMENT AMONG WOMEN WITH CHILDREN AGES 6 TO 17 YEARS
0.0/ 100
METRIC RATING
334th/ 347
METRIC RANK
10.0%
UNEMPLOYMENT AMONG WOMEN WITH CHILDREN AGES 6 TO 17 YEARS
0.0/ 100
METRIC RATING
290th/ 347
METRIC RANK
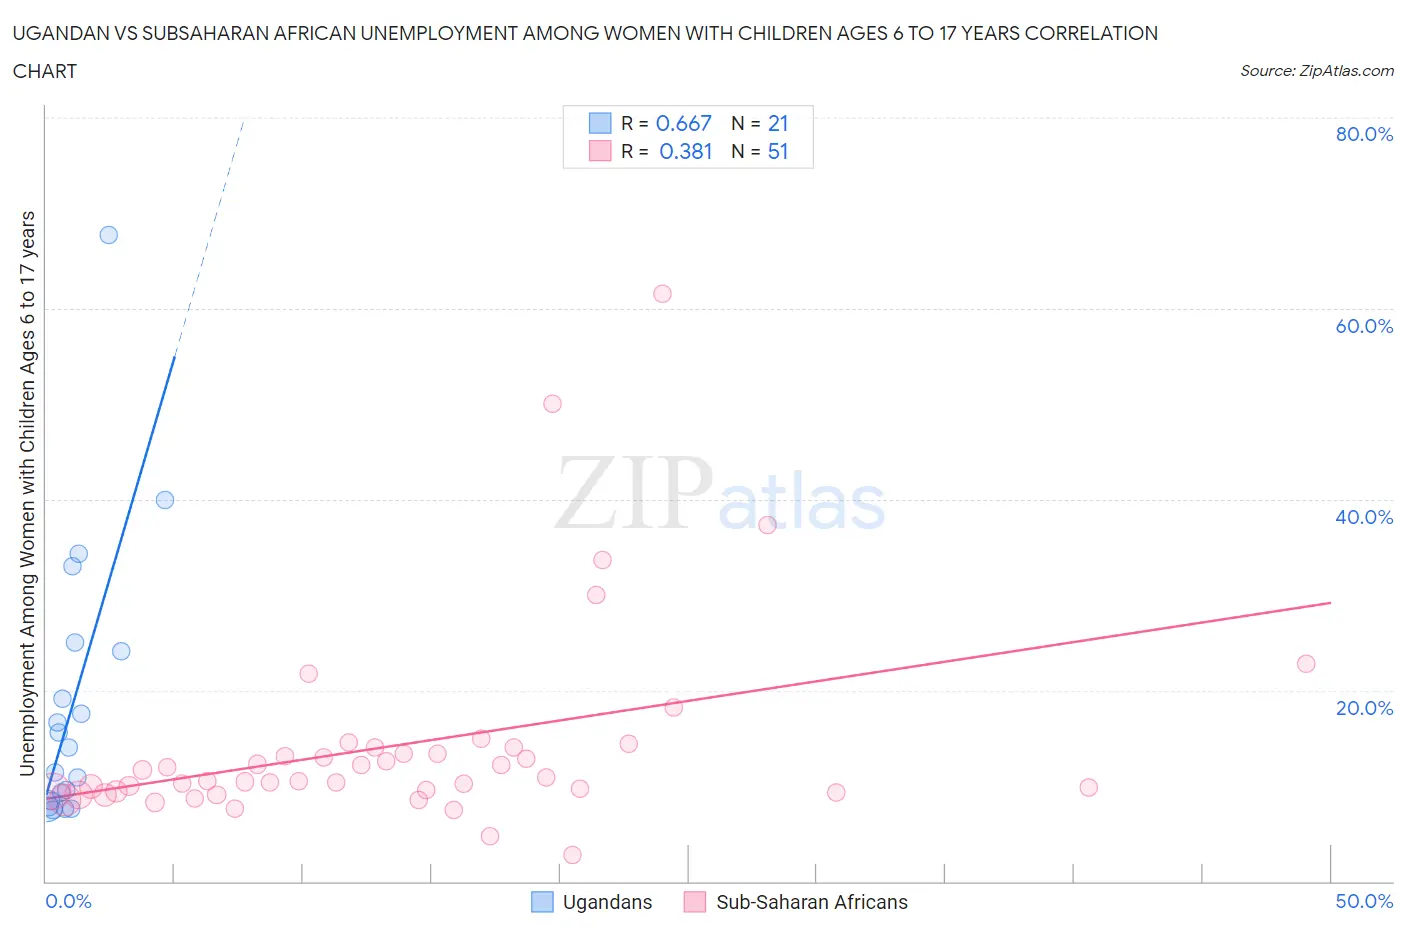
Ugandan vs Subsaharan African Unemployment Among Women with Children Ages 6 to 17 years Correlation Chart
The statistical analysis conducted on geographies consisting of 84,445,978 people shows a significant positive correlation between the proportion of Ugandans and unemployment rate among women with children between the ages 6 and 17 in the United States with a correlation coefficient (R) of 0.667 and weighted average of 12.0%. Similarly, the statistical analysis conducted on geographies consisting of 345,149,119 people shows a mild positive correlation between the proportion of Sub-Saharan Africans and unemployment rate among women with children between the ages 6 and 17 in the United States with a correlation coefficient (R) of 0.381 and weighted average of 10.0%, a difference of 20.2%.
Unemployment Among Women with Children Ages 6 to 17 years Correlation Summary
| Measurement | Ugandan | Subsaharan African |
| Minimum | 7.4% | 2.8% |
| Maximum | 67.7% | 61.5% |
| Range | 60.3% | 58.7% |
| Mean | 18.8% | 14.3% |
| Median | 14.0% | 10.5% |
| Interquartile 25% (IQ1) | 8.1% | 9.4% |
| Interquartile 75% (IQ3) | 24.6% | 14.0% |
| Interquartile Range (IQR) | 16.4% | 4.6% |
| Standard Deviation (Sample) | 14.9% | 10.6% |
| Standard Deviation (Population) | 14.5% | 10.5% |
Similar Demographics by Unemployment Among Women with Children Ages 6 to 17 years
Demographics Similar to Ugandans by Unemployment Among Women with Children Ages 6 to 17 years
In terms of unemployment among women with children ages 6 to 17 years, the demographic groups most similar to Ugandans are Colville (12.3%, a difference of 2.7%), Houma (12.5%, a difference of 3.7%), Native/Alaskan (11.5%, a difference of 4.9%), Tsimshian (11.4%, a difference of 5.6%), and Black/African American (11.4%, a difference of 5.7%).
| Demographics | Rating | Rank | Unemployment Among Women with Children Ages 6 to 17 years |
| Cape Verdeans | 0.0 /100 | #327 | Tragic 10.9% |
| Ottawa | 0.0 /100 | #328 | Tragic 10.9% |
| Pennsylvania Germans | 0.0 /100 | #329 | Tragic 11.0% |
| Chippewa | 0.0 /100 | #330 | Tragic 11.1% |
| Blacks/African Americans | 0.0 /100 | #331 | Tragic 11.4% |
| Tsimshian | 0.0 /100 | #332 | Tragic 11.4% |
| Natives/Alaskans | 0.0 /100 | #333 | Tragic 11.5% |
| Ugandans | 0.0 /100 | #334 | Tragic 12.0% |
| Colville | 0.0 /100 | #335 | Tragic 12.3% |
| Houma | 0.0 /100 | #336 | Tragic 12.5% |
| Immigrants | Yemen | 0.0 /100 | #337 | Tragic 12.7% |
| Hopi | 0.0 /100 | #338 | Tragic 12.9% |
| Sioux | 0.0 /100 | #339 | Tragic 13.2% |
| Puerto Ricans | 0.0 /100 | #340 | Tragic 13.9% |
| Navajo | 0.0 /100 | #341 | Tragic 14.2% |
Demographics Similar to Sub-Saharan Africans by Unemployment Among Women with Children Ages 6 to 17 years
In terms of unemployment among women with children ages 6 to 17 years, the demographic groups most similar to Sub-Saharan Africans are Honduran (10.0%, a difference of 0.010%), Nonimmigrants (10.0%, a difference of 0.020%), Carpatho Rusyn (10.0%, a difference of 0.030%), Haitian (10.0%, a difference of 0.12%), and Ecuadorian (10.0%, a difference of 0.22%).
| Demographics | Rating | Rank | Unemployment Among Women with Children Ages 6 to 17 years |
| Central American Indians | 0.0 /100 | #283 | Tragic 9.9% |
| Yakama | 0.0 /100 | #284 | Tragic 9.9% |
| Hispanics or Latinos | 0.0 /100 | #285 | Tragic 9.9% |
| Choctaw | 0.0 /100 | #286 | Tragic 9.9% |
| Sierra Leoneans | 0.0 /100 | #287 | Tragic 9.9% |
| Shoshone | 0.0 /100 | #288 | Tragic 10.0% |
| Hondurans | 0.0 /100 | #289 | Tragic 10.0% |
| Sub-Saharan Africans | 0.0 /100 | #290 | Tragic 10.0% |
| Immigrants | Nonimmigrants | 0.0 /100 | #291 | Tragic 10.0% |
| Carpatho Rusyns | 0.0 /100 | #292 | Tragic 10.0% |
| Haitians | 0.0 /100 | #293 | Tragic 10.0% |
| Ecuadorians | 0.0 /100 | #294 | Tragic 10.0% |
| Cherokee | 0.0 /100 | #295 | Tragic 10.0% |
| Immigrants | Western Africa | 0.0 /100 | #296 | Tragic 10.1% |
| Immigrants | Caribbean | 0.0 /100 | #297 | Tragic 10.1% |