Tohono O'odham vs Immigrants from North Macedonia Unemployment Among Women with Children Ages 6 to 17 years
COMPARE
Tohono O'odham
Immigrants from North Macedonia
Unemployment Among Women with Children Ages 6 to 17 years
Unemployment Among Women with Children Ages 6 to 17 years Comparison
Tohono O'odham
Immigrants from North Macedonia
10.7%
UNEMPLOYMENT AMONG WOMEN WITH CHILDREN AGES 6 TO 17 YEARS
0.0/ 100
METRIC RATING
321st/ 347
METRIC RANK
8.5%
UNEMPLOYMENT AMONG WOMEN WITH CHILDREN AGES 6 TO 17 YEARS
99.4/ 100
METRIC RATING
85th/ 347
METRIC RANK
Tohono O'odham vs Immigrants from North Macedonia Unemployment Among Women with Children Ages 6 to 17 years Correlation Chart
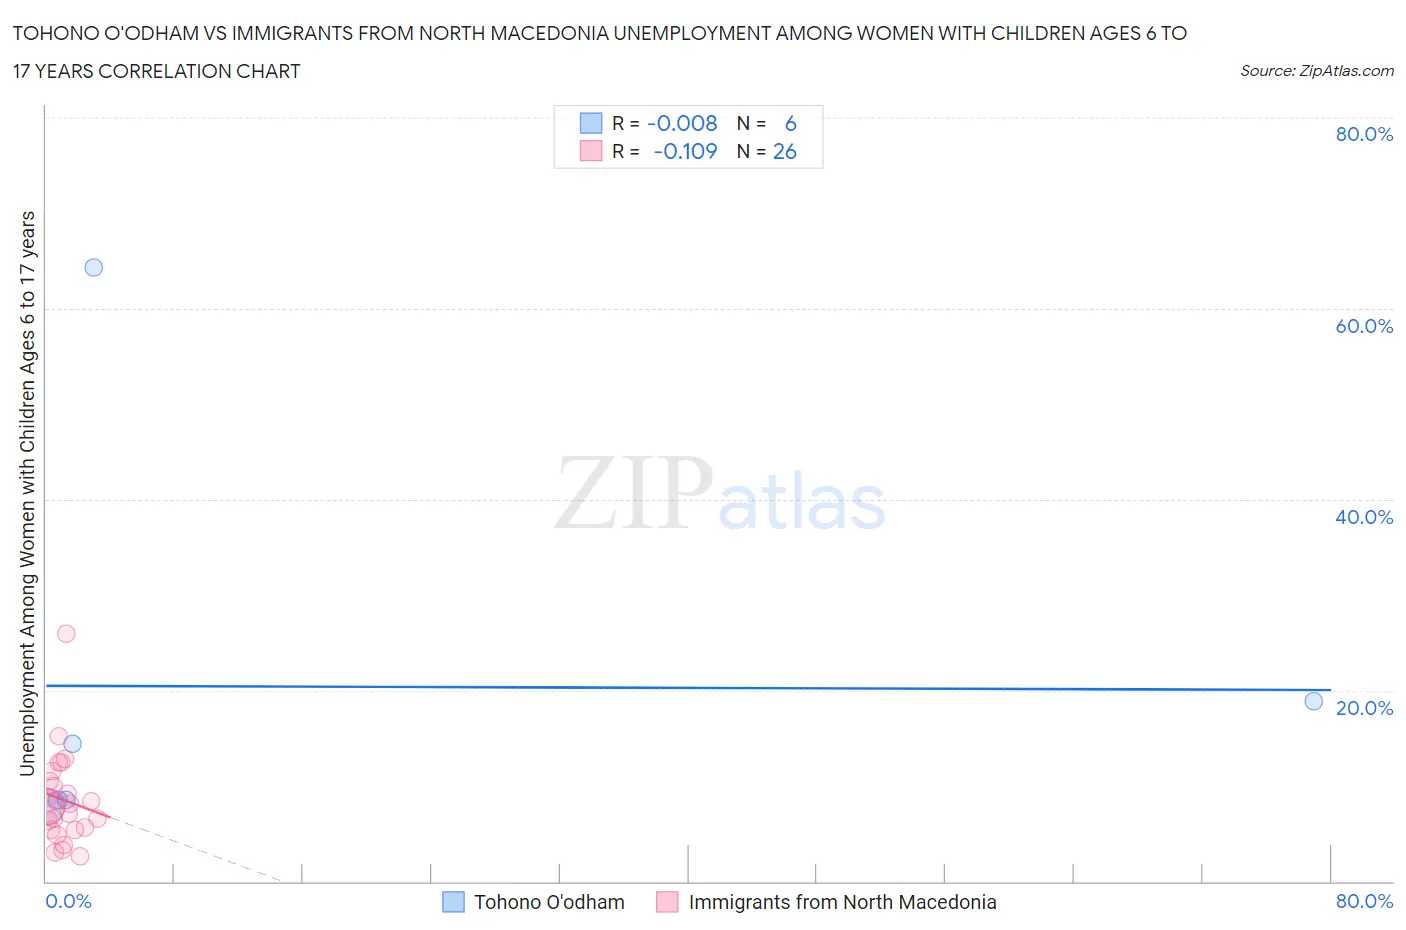
The statistical analysis conducted on geographies consisting of 54,737,899 people shows no correlation between the proportion of Tohono O'odham and unemployment rate among women with children between the ages 6 and 17 in the United States with a correlation coefficient (R) of -0.008 and weighted average of 10.7%. Similarly, the statistical analysis conducted on geographies consisting of 63,088,310 people shows a poor negative correlation between the proportion of Immigrants from North Macedonia and unemployment rate among women with children between the ages 6 and 17 in the United States with a correlation coefficient (R) of -0.109 and weighted average of 8.5%, a difference of 26.3%.
Unemployment Among Women with Children Ages 6 to 17 years Correlation Summary
| Measurement | Tohono O'odham | Immigrants from North Macedonia |
| Minimum | 7.8% | 2.6% |
| Maximum | 64.3% | 25.9% |
| Range | 56.5% | 23.3% |
| Mean | 20.4% | 8.5% |
| Median | 11.5% | 7.9% |
| Interquartile 25% (IQ1) | 8.5% | 5.4% |
| Interquartile 75% (IQ3) | 18.8% | 10.5% |
| Interquartile Range (IQR) | 10.3% | 5.1% |
| Standard Deviation (Sample) | 21.9% | 4.8% |
| Standard Deviation (Population) | 20.0% | 4.7% |
Similar Demographics by Unemployment Among Women with Children Ages 6 to 17 years
Demographics Similar to Tohono O'odham by Unemployment Among Women with Children Ages 6 to 17 years
In terms of unemployment among women with children ages 6 to 17 years, the demographic groups most similar to Tohono O'odham are Apache (10.7%, a difference of 0.17%), Immigrants from Uganda (10.7%, a difference of 0.19%), Cree (10.8%, a difference of 1.3%), Dominican (10.8%, a difference of 1.3%), and Immigrants from Dominican Republic (10.8%, a difference of 1.4%).
| Demographics | Rating | Rank | Unemployment Among Women with Children Ages 6 to 17 years |
| Immigrants | Cabo Verde | 0.0 /100 | #314 | Tragic 10.4% |
| Bahamians | 0.0 /100 | #315 | Tragic 10.4% |
| Immigrants | Dominica | 0.0 /100 | #316 | Tragic 10.5% |
| Bermudans | 0.0 /100 | #317 | Tragic 10.5% |
| Delaware | 0.0 /100 | #318 | Tragic 10.5% |
| Immigrants | Uganda | 0.0 /100 | #319 | Tragic 10.7% |
| Apache | 0.0 /100 | #320 | Tragic 10.7% |
| Tohono O'odham | 0.0 /100 | #321 | Tragic 10.7% |
| Cree | 0.0 /100 | #322 | Tragic 10.8% |
| Dominicans | 0.0 /100 | #323 | Tragic 10.8% |
| Immigrants | Dominican Republic | 0.0 /100 | #324 | Tragic 10.8% |
| Cajuns | 0.0 /100 | #325 | Tragic 10.8% |
| Liberians | 0.0 /100 | #326 | Tragic 10.8% |
| Cape Verdeans | 0.0 /100 | #327 | Tragic 10.9% |
| Ottawa | 0.0 /100 | #328 | Tragic 10.9% |
Demographics Similar to Immigrants from North Macedonia by Unemployment Among Women with Children Ages 6 to 17 years
In terms of unemployment among women with children ages 6 to 17 years, the demographic groups most similar to Immigrants from North Macedonia are Japanese (8.4%, a difference of 0.040%), Alaskan Athabascan (8.5%, a difference of 0.15%), Bulgarian (8.4%, a difference of 0.16%), Cypriot (8.4%, a difference of 0.32%), and Immigrants from Bolivia (8.4%, a difference of 0.34%).
| Demographics | Rating | Rank | Unemployment Among Women with Children Ages 6 to 17 years |
| Pakistanis | 99.6 /100 | #78 | Exceptional 8.4% |
| Mongolians | 99.6 /100 | #79 | Exceptional 8.4% |
| Immigrants | Belarus | 99.6 /100 | #80 | Exceptional 8.4% |
| Immigrants | Bolivia | 99.6 /100 | #81 | Exceptional 8.4% |
| Cypriots | 99.6 /100 | #82 | Exceptional 8.4% |
| Bulgarians | 99.5 /100 | #83 | Exceptional 8.4% |
| Japanese | 99.5 /100 | #84 | Exceptional 8.4% |
| Immigrants | North Macedonia | 99.4 /100 | #85 | Exceptional 8.5% |
| Alaskan Athabascans | 99.4 /100 | #86 | Exceptional 8.5% |
| Immigrants | Israel | 99.1 /100 | #87 | Exceptional 8.5% |
| Immigrants | Vietnam | 99.1 /100 | #88 | Exceptional 8.5% |
| Paiute | 99.1 /100 | #89 | Exceptional 8.5% |
| Yugoslavians | 99.0 /100 | #90 | Exceptional 8.5% |
| Immigrants | Eastern Europe | 99.0 /100 | #91 | Exceptional 8.5% |
| Potawatomi | 99.0 /100 | #92 | Exceptional 8.5% |