Tohono O'odham vs Subsaharan African Disability Age Over 75
COMPARE
Tohono O'odham
Subsaharan African
Disability Age Over 75
Disability Age Over 75 Comparison
Tohono O'odham
Sub-Saharan Africans
56.7%
DISABILITY AGE OVER 75
0.0/ 100
METRIC RATING
343rd/ 347
METRIC RANK
48.2%
DISABILITY AGE OVER 75
3.8/ 100
METRIC RATING
234th/ 347
METRIC RANK
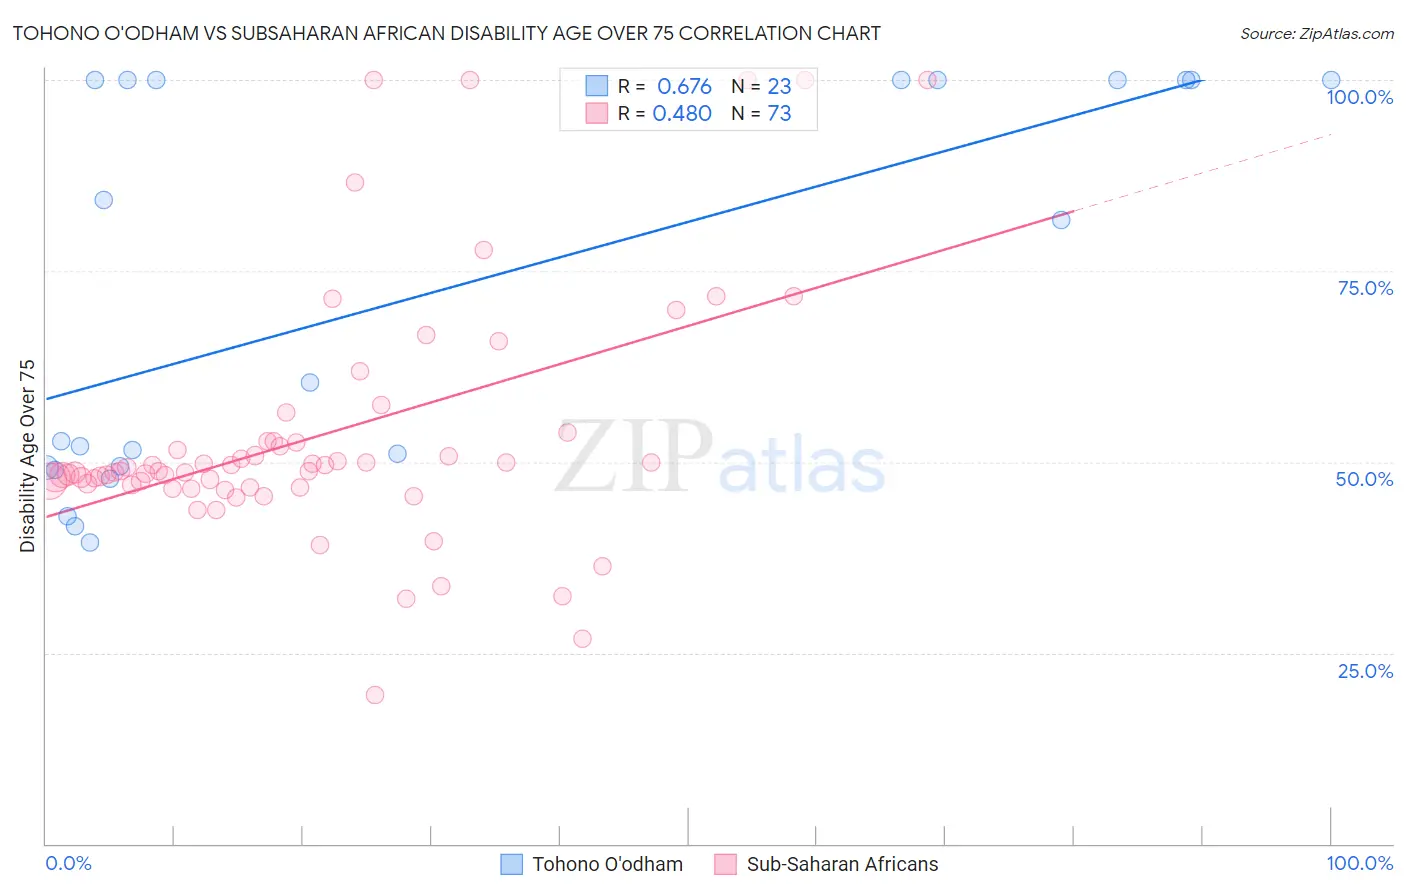
Tohono O'odham vs Subsaharan African Disability Age Over 75 Correlation Chart
The statistical analysis conducted on geographies consisting of 58,667,406 people shows a significant positive correlation between the proportion of Tohono O'odham and percentage of population with a disability over the age of 75 in the United States with a correlation coefficient (R) of 0.676 and weighted average of 56.7%. Similarly, the statistical analysis conducted on geographies consisting of 506,598,024 people shows a moderate positive correlation between the proportion of Sub-Saharan Africans and percentage of population with a disability over the age of 75 in the United States with a correlation coefficient (R) of 0.480 and weighted average of 48.2%, a difference of 17.7%.
Disability Age Over 75 Correlation Summary
| Measurement | Tohono O'odham | Subsaharan African |
| Minimum | 39.4% | 19.4% |
| Maximum | 100.0% | 100.0% |
| Range | 60.6% | 80.6% |
| Mean | 71.9% | 53.4% |
| Median | 60.4% | 48.8% |
| Interquartile 25% (IQ1) | 49.2% | 46.9% |
| Interquartile 75% (IQ3) | 100.0% | 52.7% |
| Interquartile Range (IQR) | 50.8% | 5.8% |
| Standard Deviation (Sample) | 25.3% | 16.4% |
| Standard Deviation (Population) | 24.7% | 16.3% |
Similar Demographics by Disability Age Over 75
Demographics Similar to Tohono O'odham by Disability Age Over 75
In terms of disability age over 75, the demographic groups most similar to Tohono O'odham are Lumbee (56.2%, a difference of 0.83%), Houma (56.2%, a difference of 1.0%), Pueblo (55.9%, a difference of 1.5%), Pima (55.8%, a difference of 1.6%), and Colville (55.4%, a difference of 2.4%).
| Demographics | Rating | Rank | Disability Age Over 75 |
| Apache | 0.0 /100 | #333 | Tragic 53.6% |
| Alaskan Athabascans | 0.0 /100 | #334 | Tragic 54.0% |
| Kiowa | 0.0 /100 | #335 | Tragic 54.2% |
| Immigrants | Armenia | 0.0 /100 | #336 | Tragic 54.3% |
| Yuman | 0.0 /100 | #337 | Tragic 54.4% |
| Colville | 0.0 /100 | #338 | Tragic 55.4% |
| Pima | 0.0 /100 | #339 | Tragic 55.8% |
| Pueblo | 0.0 /100 | #340 | Tragic 55.9% |
| Houma | 0.0 /100 | #341 | Tragic 56.2% |
| Lumbee | 0.0 /100 | #342 | Tragic 56.2% |
| Tohono O'odham | 0.0 /100 | #343 | Tragic 56.7% |
| Navajo | 0.0 /100 | #344 | Tragic 58.3% |
| Inupiat | 0.0 /100 | #345 | Tragic 58.4% |
| Tsimshian | 0.0 /100 | #346 | Tragic 59.2% |
| Yup'ik | 0.0 /100 | #347 | Tragic 61.1% |
Demographics Similar to Sub-Saharan Africans by Disability Age Over 75
In terms of disability age over 75, the demographic groups most similar to Sub-Saharan Africans are Hmong (48.2%, a difference of 0.0%), Indonesian (48.2%, a difference of 0.060%), Cree (48.2%, a difference of 0.060%), Immigrants (48.2%, a difference of 0.080%), and Taiwanese (48.2%, a difference of 0.090%).
| Demographics | Rating | Rank | Disability Age Over 75 |
| Zimbabweans | 6.4 /100 | #227 | Tragic 48.1% |
| Immigrants | Liberia | 5.9 /100 | #228 | Tragic 48.1% |
| Spaniards | 5.7 /100 | #229 | Tragic 48.1% |
| Taiwanese | 4.4 /100 | #230 | Tragic 48.2% |
| Immigrants | Immigrants | 4.3 /100 | #231 | Tragic 48.2% |
| Indonesians | 4.2 /100 | #232 | Tragic 48.2% |
| Cree | 4.2 /100 | #233 | Tragic 48.2% |
| Sub-Saharan Africans | 3.8 /100 | #234 | Tragic 48.2% |
| Hmong | 3.8 /100 | #235 | Tragic 48.2% |
| Immigrants | Nicaragua | 3.2 /100 | #236 | Tragic 48.2% |
| Immigrants | St. Vincent and the Grenadines | 3.2 /100 | #237 | Tragic 48.2% |
| Nicaraguans | 3.0 /100 | #238 | Tragic 48.3% |
| Immigrants | Thailand | 2.8 /100 | #239 | Tragic 48.3% |
| Tongans | 2.3 /100 | #240 | Tragic 48.3% |
| Native Hawaiians | 2.2 /100 | #241 | Tragic 48.3% |