Tohono O'odham vs Ute Unemployment Among Women with Children Ages 6 to 17 years
COMPARE
Tohono O'odham
Ute
Unemployment Among Women with Children Ages 6 to 17 years
Unemployment Among Women with Children Ages 6 to 17 years Comparison
Tohono O'odham
Ute
10.7%
UNEMPLOYMENT AMONG WOMEN WITH CHILDREN AGES 6 TO 17 YEARS
0.0/ 100
METRIC RATING
321st/ 347
METRIC RANK
7.0%
UNEMPLOYMENT AMONG WOMEN WITH CHILDREN AGES 6 TO 17 YEARS
100.0/ 100
METRIC RATING
4th/ 347
METRIC RANK
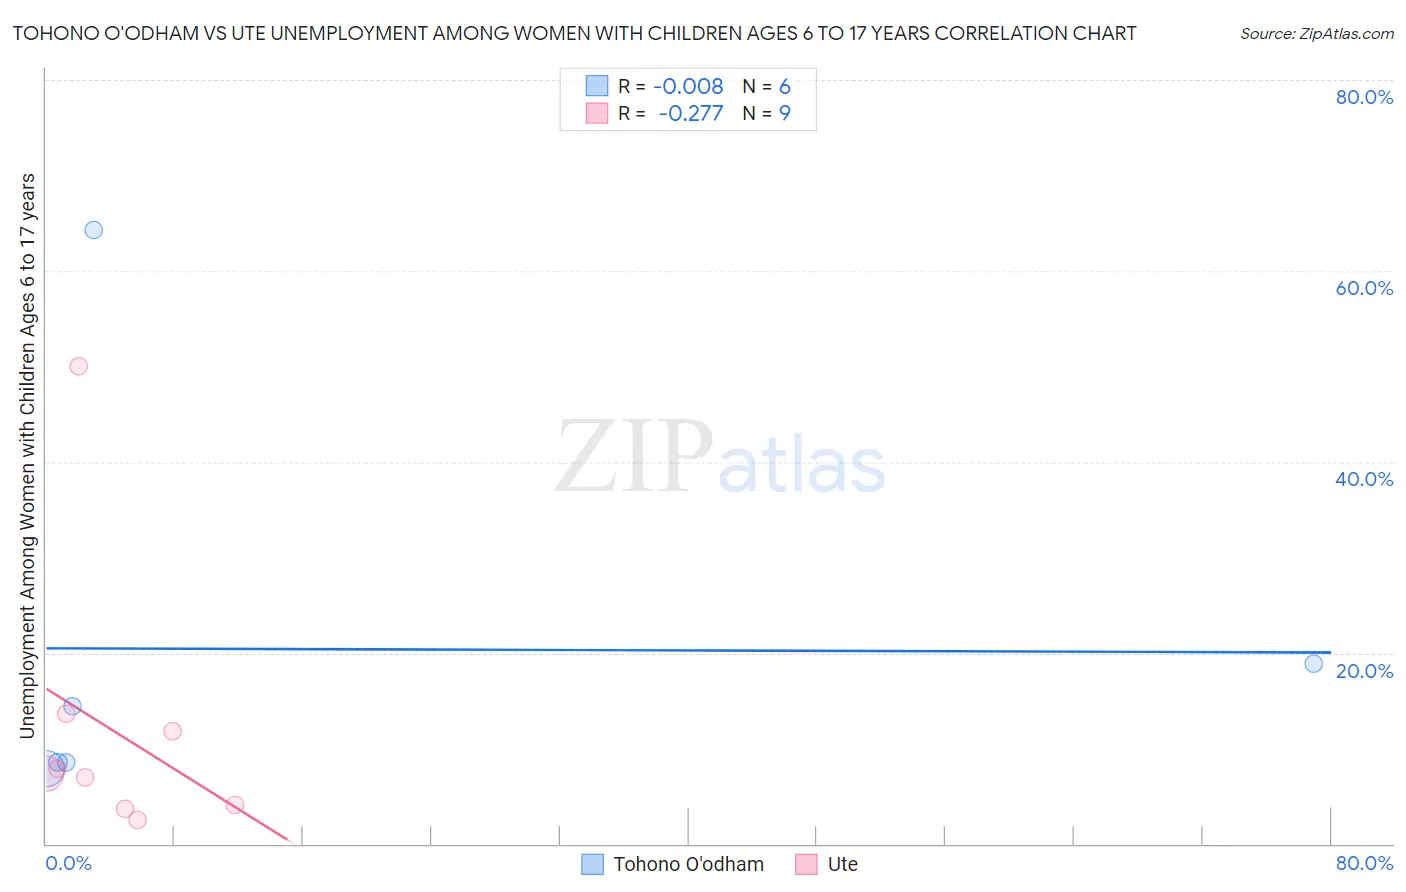
Tohono O'odham vs Ute Unemployment Among Women with Children Ages 6 to 17 years Correlation Chart
The statistical analysis conducted on geographies consisting of 54,737,899 people shows no correlation between the proportion of Tohono O'odham and unemployment rate among women with children between the ages 6 and 17 in the United States with a correlation coefficient (R) of -0.008 and weighted average of 10.7%. Similarly, the statistical analysis conducted on geographies consisting of 50,489,522 people shows a weak negative correlation between the proportion of Ute and unemployment rate among women with children between the ages 6 and 17 in the United States with a correlation coefficient (R) of -0.277 and weighted average of 7.0%, a difference of 52.3%.
Unemployment Among Women with Children Ages 6 to 17 years Correlation Summary
| Measurement | Tohono O'odham | Ute |
| Minimum | 7.8% | 2.5% |
| Maximum | 64.3% | 50.0% |
| Range | 56.5% | 47.5% |
| Mean | 20.4% | 12.0% |
| Median | 11.5% | 7.4% |
| Interquartile 25% (IQ1) | 8.5% | 3.8% |
| Interquartile 75% (IQ3) | 18.8% | 12.7% |
| Interquartile Range (IQR) | 10.3% | 8.8% |
| Standard Deviation (Sample) | 21.9% | 14.7% |
| Standard Deviation (Population) | 20.0% | 13.9% |
Similar Demographics by Unemployment Among Women with Children Ages 6 to 17 years
Demographics Similar to Tohono O'odham by Unemployment Among Women with Children Ages 6 to 17 years
In terms of unemployment among women with children ages 6 to 17 years, the demographic groups most similar to Tohono O'odham are Apache (10.7%, a difference of 0.17%), Immigrants from Uganda (10.7%, a difference of 0.19%), Cree (10.8%, a difference of 1.3%), Dominican (10.8%, a difference of 1.3%), and Immigrants from Dominican Republic (10.8%, a difference of 1.4%).
| Demographics | Rating | Rank | Unemployment Among Women with Children Ages 6 to 17 years |
| Immigrants | Cabo Verde | 0.0 /100 | #314 | Tragic 10.4% |
| Bahamians | 0.0 /100 | #315 | Tragic 10.4% |
| Immigrants | Dominica | 0.0 /100 | #316 | Tragic 10.5% |
| Bermudans | 0.0 /100 | #317 | Tragic 10.5% |
| Delaware | 0.0 /100 | #318 | Tragic 10.5% |
| Immigrants | Uganda | 0.0 /100 | #319 | Tragic 10.7% |
| Apache | 0.0 /100 | #320 | Tragic 10.7% |
| Tohono O'odham | 0.0 /100 | #321 | Tragic 10.7% |
| Cree | 0.0 /100 | #322 | Tragic 10.8% |
| Dominicans | 0.0 /100 | #323 | Tragic 10.8% |
| Immigrants | Dominican Republic | 0.0 /100 | #324 | Tragic 10.8% |
| Cajuns | 0.0 /100 | #325 | Tragic 10.8% |
| Liberians | 0.0 /100 | #326 | Tragic 10.8% |
| Cape Verdeans | 0.0 /100 | #327 | Tragic 10.9% |
| Ottawa | 0.0 /100 | #328 | Tragic 10.9% |
Demographics Similar to Ute by Unemployment Among Women with Children Ages 6 to 17 years
In terms of unemployment among women with children ages 6 to 17 years, the demographic groups most similar to Ute are Okinawan (7.0%, a difference of 0.60%), Tlingit-Haida (7.1%, a difference of 1.1%), Soviet Union (7.1%, a difference of 1.1%), Immigrants from Hong Kong (7.2%, a difference of 2.6%), and Assyrian/Chaldean/Syriac (7.2%, a difference of 2.9%).
| Demographics | Rating | Rank | Unemployment Among Women with Children Ages 6 to 17 years |
| Taiwanese | 100.0 /100 | #1 | Exceptional 6.5% |
| Fijians | 100.0 /100 | #2 | Exceptional 6.6% |
| Tongans | 100.0 /100 | #3 | Exceptional 6.7% |
| Ute | 100.0 /100 | #4 | Exceptional 7.0% |
| Okinawans | 100.0 /100 | #5 | Exceptional 7.0% |
| Tlingit-Haida | 100.0 /100 | #6 | Exceptional 7.1% |
| Soviet Union | 100.0 /100 | #7 | Exceptional 7.1% |
| Immigrants | Hong Kong | 100.0 /100 | #8 | Exceptional 7.2% |
| Assyrians/Chaldeans/Syriacs | 100.0 /100 | #9 | Exceptional 7.2% |
| Immigrants | Fiji | 100.0 /100 | #10 | Exceptional 7.3% |
| Immigrants | Taiwan | 100.0 /100 | #11 | Exceptional 7.3% |
| Bangladeshis | 100.0 /100 | #12 | Exceptional 7.4% |
| Indonesians | 100.0 /100 | #13 | Exceptional 7.4% |
| Sudanese | 100.0 /100 | #14 | Exceptional 7.4% |
| Puget Sound Salish | 100.0 /100 | #15 | Exceptional 7.5% |