Syrian vs Delaware Male Unemployment
COMPARE
Syrian
Delaware
Male Unemployment
Male Unemployment Comparison
Syrians
Delaware
5.2%
MALE UNEMPLOYMENT
78.0/ 100
METRIC RATING
143rd/ 347
METRIC RANK
5.5%
MALE UNEMPLOYMENT
4.2/ 100
METRIC RATING
217th/ 347
METRIC RANK
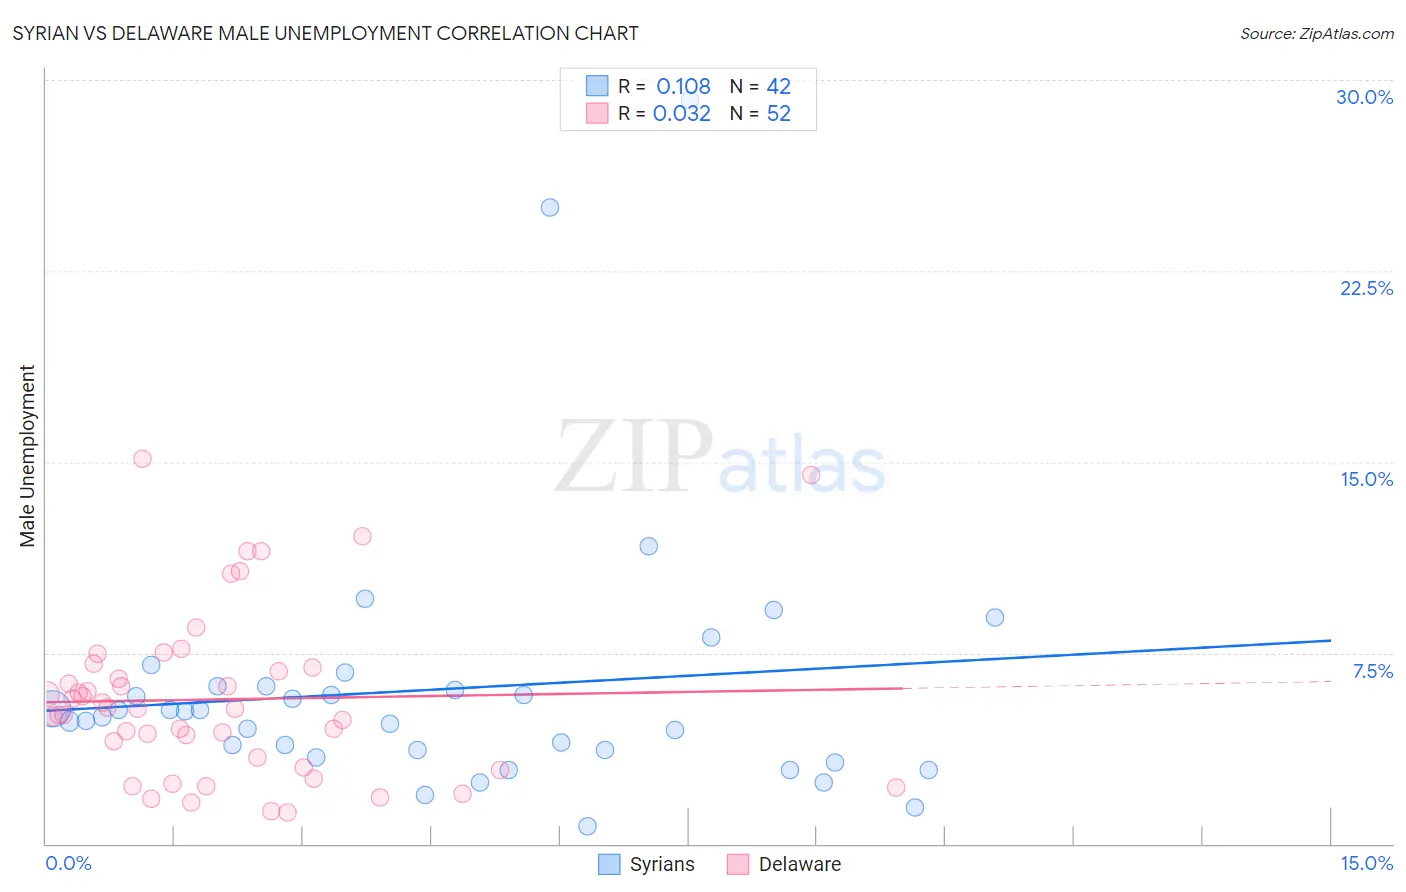
Syrian vs Delaware Male Unemployment Correlation Chart
The statistical analysis conducted on geographies consisting of 265,748,464 people shows a poor positive correlation between the proportion of Syrians and unemployment rate among males in the United States with a correlation coefficient (R) of 0.108 and weighted average of 5.2%. Similarly, the statistical analysis conducted on geographies consisting of 96,069,149 people shows no correlation between the proportion of Delaware and unemployment rate among males in the United States with a correlation coefficient (R) of 0.032 and weighted average of 5.5%, a difference of 6.5%.
Male Unemployment Correlation Summary
| Measurement | Syrian | Delaware |
| Minimum | 0.70% | 1.2% |
| Maximum | 29.2% | 15.1% |
| Range | 28.5% | 13.9% |
| Mean | 6.1% | 5.7% |
| Median | 5.1% | 5.3% |
| Interquartile 25% (IQ1) | 3.7% | 3.2% |
| Interquartile 75% (IQ3) | 6.2% | 6.8% |
| Interquartile Range (IQR) | 2.5% | 3.6% |
| Standard Deviation (Sample) | 5.3% | 3.3% |
| Standard Deviation (Population) | 5.2% | 3.2% |
Similar Demographics by Male Unemployment
Demographics Similar to Syrians by Male Unemployment
In terms of male unemployment, the demographic groups most similar to Syrians are Sri Lankan (5.2%, a difference of 0.010%), Macedonian (5.2%, a difference of 0.020%), Fijian (5.2%, a difference of 0.030%), Immigrants from Kenya (5.2%, a difference of 0.030%), and Immigrants from Burma/Myanmar (5.2%, a difference of 0.040%).
| Demographics | Rating | Rank | Male Unemployment |
| Lebanese | 79.9 /100 | #136 | Good 5.2% |
| Immigrants | Eastern Africa | 79.8 /100 | #137 | Good 5.2% |
| Immigrants | Croatia | 79.7 /100 | #138 | Good 5.2% |
| Kenyans | 79.4 /100 | #139 | Good 5.2% |
| Brazilians | 79.3 /100 | #140 | Good 5.2% |
| Immigrants | Switzerland | 79.2 /100 | #141 | Good 5.2% |
| Fijians | 78.3 /100 | #142 | Good 5.2% |
| Syrians | 78.0 /100 | #143 | Good 5.2% |
| Sri Lankans | 77.9 /100 | #144 | Good 5.2% |
| Macedonians | 77.7 /100 | #145 | Good 5.2% |
| Immigrants | Kenya | 77.6 /100 | #146 | Good 5.2% |
| Immigrants | Burma/Myanmar | 77.5 /100 | #147 | Good 5.2% |
| Immigrants | Italy | 76.3 /100 | #148 | Good 5.2% |
| Immigrants | Europe | 76.2 /100 | #149 | Good 5.2% |
| Indians (Asian) | 76.0 /100 | #150 | Good 5.2% |
Demographics Similar to Delaware by Male Unemployment
In terms of male unemployment, the demographic groups most similar to Delaware are Immigrants (5.5%, a difference of 0.050%), Immigrants from Albania (5.5%, a difference of 0.21%), Samoan (5.5%, a difference of 0.22%), Immigrants from Western Asia (5.6%, a difference of 0.25%), and Portuguese (5.6%, a difference of 0.28%).
| Demographics | Rating | Rank | Male Unemployment |
| South American Indians | 7.6 /100 | #210 | Tragic 5.5% |
| Israelis | 7.4 /100 | #211 | Tragic 5.5% |
| Hmong | 7.0 /100 | #212 | Tragic 5.5% |
| Ugandans | 6.3 /100 | #213 | Tragic 5.5% |
| Puget Sound Salish | 5.6 /100 | #214 | Tragic 5.5% |
| Samoans | 4.9 /100 | #215 | Tragic 5.5% |
| Immigrants | Immigrants | 4.3 /100 | #216 | Tragic 5.5% |
| Delaware | 4.2 /100 | #217 | Tragic 5.5% |
| Immigrants | Albania | 3.6 /100 | #218 | Tragic 5.5% |
| Immigrants | Western Asia | 3.5 /100 | #219 | Tragic 5.6% |
| Portuguese | 3.5 /100 | #220 | Tragic 5.6% |
| Soviet Union | 3.2 /100 | #221 | Tragic 5.6% |
| Immigrants | Micronesia | 2.9 /100 | #222 | Tragic 5.6% |
| Creek | 2.6 /100 | #223 | Tragic 5.6% |
| Cherokee | 2.4 /100 | #224 | Tragic 5.6% |