Syrian vs Immigrants from Bolivia Family Households with Children
COMPARE
Syrian
Immigrants from Bolivia
Family Households with Children
Family Households with Children Comparison
Syrians
Immigrants from Bolivia
27.8%
FAMILY HOUSEHOLDS WITH CHILDREN
89.7/ 100
METRIC RATING
128th/ 347
METRIC RANK
29.3%
FAMILY HOUSEHOLDS WITH CHILDREN
100.0/ 100
METRIC RATING
34th/ 347
METRIC RANK
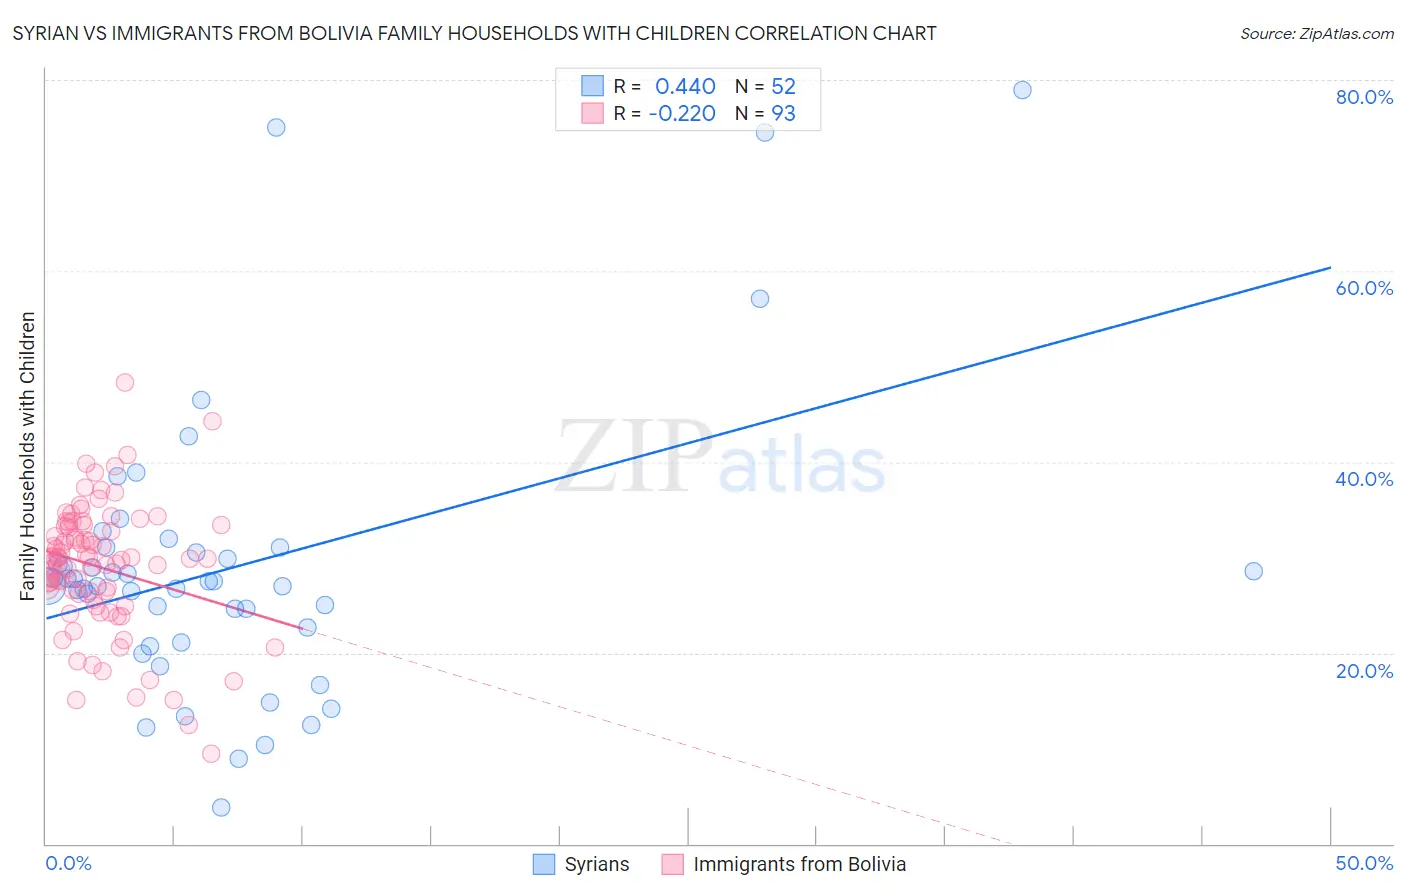
Syrian vs Immigrants from Bolivia Family Households with Children Correlation Chart
The statistical analysis conducted on geographies consisting of 266,095,178 people shows a moderate positive correlation between the proportion of Syrians and percentage of family households with children in the United States with a correlation coefficient (R) of 0.440 and weighted average of 27.8%. Similarly, the statistical analysis conducted on geographies consisting of 158,666,427 people shows a weak negative correlation between the proportion of Immigrants from Bolivia and percentage of family households with children in the United States with a correlation coefficient (R) of -0.220 and weighted average of 29.3%, a difference of 5.7%.
Family Households with Children Correlation Summary
| Measurement | Syrian | Immigrants from Bolivia |
| Minimum | 3.8% | 9.4% |
| Maximum | 78.9% | 48.4% |
| Range | 75.1% | 39.0% |
| Mean | 29.0% | 29.0% |
| Median | 27.2% | 29.9% |
| Interquartile 25% (IQ1) | 21.8% | 25.8% |
| Interquartile 75% (IQ3) | 30.8% | 33.3% |
| Interquartile Range (IQR) | 8.9% | 7.4% |
| Standard Deviation (Sample) | 15.0% | 6.7% |
| Standard Deviation (Population) | 14.8% | 6.7% |
Similar Demographics by Family Households with Children
Demographics Similar to Syrians by Family Households with Children
In terms of family households with children, the demographic groups most similar to Syrians are Belizean (27.8%, a difference of 0.020%), Immigrants from Eritrea (27.8%, a difference of 0.020%), Immigrants from Ethiopia (27.8%, a difference of 0.050%), Immigrants from Singapore (27.8%, a difference of 0.070%), and Ecuadorian (27.8%, a difference of 0.070%).
| Demographics | Rating | Rank | Family Households with Children |
| Immigrants | Western Asia | 93.6 /100 | #121 | Exceptional 27.9% |
| Immigrants | Zimbabwe | 92.8 /100 | #122 | Exceptional 27.8% |
| Immigrants | Northern Africa | 91.8 /100 | #123 | Exceptional 27.8% |
| Immigrants | Singapore | 90.8 /100 | #124 | Exceptional 27.8% |
| Ecuadorians | 90.8 /100 | #125 | Exceptional 27.8% |
| Immigrants | Ethiopia | 90.5 /100 | #126 | Exceptional 27.8% |
| Belizeans | 90.0 /100 | #127 | Exceptional 27.8% |
| Syrians | 89.7 /100 | #128 | Excellent 27.8% |
| Immigrants | Eritrea | 89.4 /100 | #129 | Excellent 27.8% |
| Cajuns | 87.6 /100 | #130 | Excellent 27.7% |
| Lebanese | 87.4 /100 | #131 | Excellent 27.7% |
| Immigrants | Belize | 85.7 /100 | #132 | Excellent 27.7% |
| Iranians | 85.2 /100 | #133 | Excellent 27.7% |
| Immigrants | Panama | 84.9 /100 | #134 | Excellent 27.7% |
| Immigrants | Ecuador | 84.6 /100 | #135 | Excellent 27.7% |
Demographics Similar to Immigrants from Bolivia by Family Households with Children
In terms of family households with children, the demographic groups most similar to Immigrants from Bolivia are Venezuelan (29.4%, a difference of 0.060%), Immigrants from Sierra Leone (29.3%, a difference of 0.16%), Immigrants from Venezuela (29.3%, a difference of 0.17%), Immigrants from Yemen (29.4%, a difference of 0.25%), and Japanese (29.4%, a difference of 0.31%).
| Demographics | Rating | Rank | Family Households with Children |
| Immigrants | Vietnam | 100.0 /100 | #27 | Exceptional 29.5% |
| Samoans | 100.0 /100 | #28 | Exceptional 29.5% |
| Bolivians | 100.0 /100 | #29 | Exceptional 29.5% |
| Yuman | 100.0 /100 | #30 | Exceptional 29.5% |
| Japanese | 100.0 /100 | #31 | Exceptional 29.4% |
| Immigrants | Yemen | 100.0 /100 | #32 | Exceptional 29.4% |
| Venezuelans | 100.0 /100 | #33 | Exceptional 29.4% |
| Immigrants | Bolivia | 100.0 /100 | #34 | Exceptional 29.3% |
| Immigrants | Sierra Leone | 100.0 /100 | #35 | Exceptional 29.3% |
| Immigrants | Venezuela | 100.0 /100 | #36 | Exceptional 29.3% |
| Immigrants | Cameroon | 100.0 /100 | #37 | Exceptional 29.2% |
| Koreans | 100.0 /100 | #38 | Exceptional 29.2% |
| Yaqui | 100.0 /100 | #39 | Exceptional 29.1% |
| Central Americans | 100.0 /100 | #40 | Exceptional 29.1% |
| Immigrants | South Eastern Asia | 100.0 /100 | #41 | Exceptional 29.1% |