Syrian vs Ecuadorian Male Unemployment
COMPARE
Syrian
Ecuadorian
Male Unemployment
Male Unemployment Comparison
Syrians
Ecuadorians
5.2%
MALE UNEMPLOYMENT
78.0/ 100
METRIC RATING
143rd/ 347
METRIC RANK
6.2%
MALE UNEMPLOYMENT
0.0/ 100
METRIC RATING
282nd/ 347
METRIC RANK
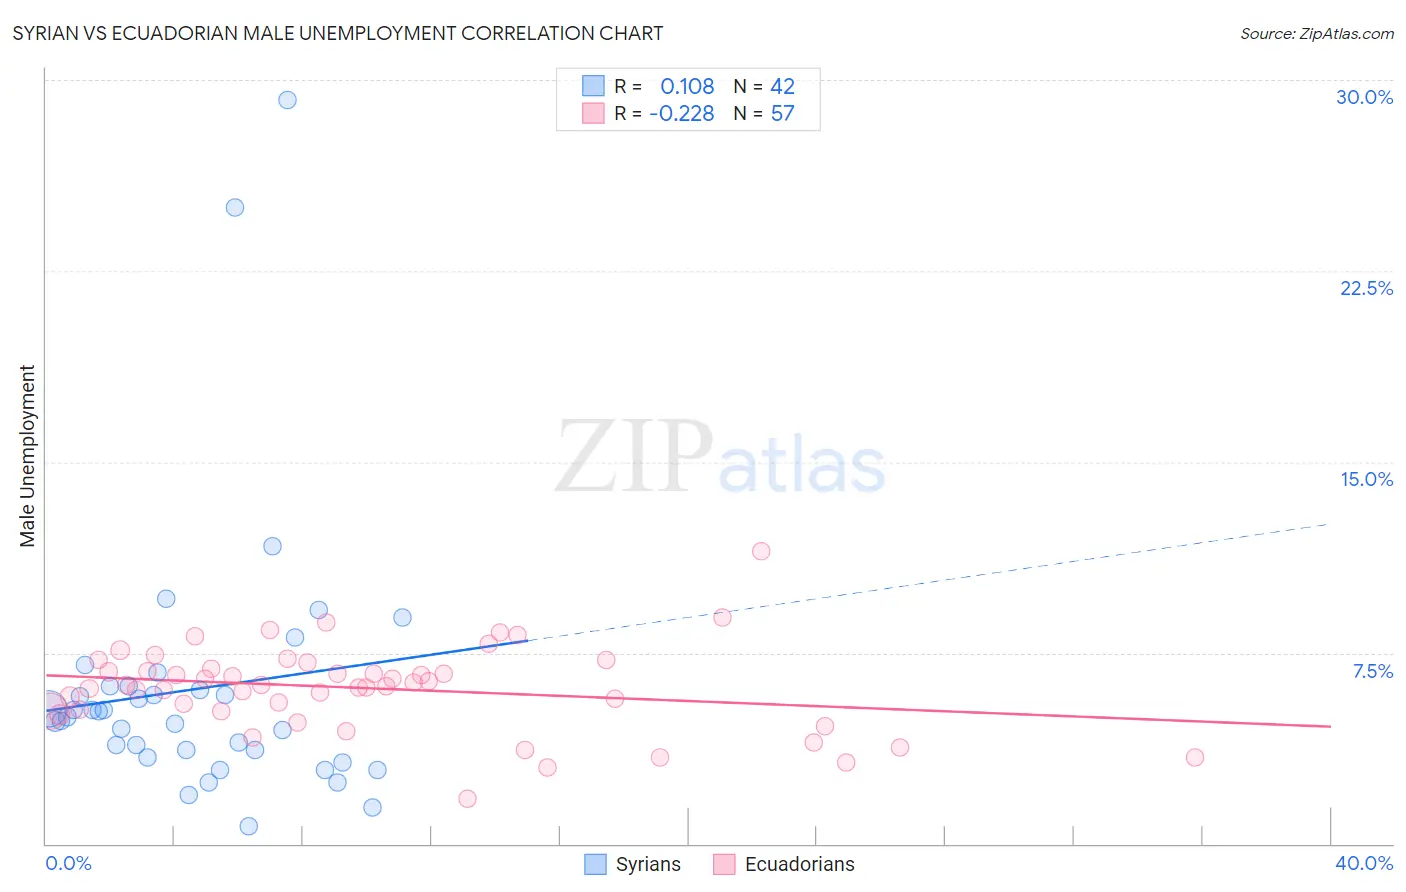
Syrian vs Ecuadorian Male Unemployment Correlation Chart
The statistical analysis conducted on geographies consisting of 265,748,464 people shows a poor positive correlation between the proportion of Syrians and unemployment rate among males in the United States with a correlation coefficient (R) of 0.108 and weighted average of 5.2%. Similarly, the statistical analysis conducted on geographies consisting of 317,005,514 people shows a weak negative correlation between the proportion of Ecuadorians and unemployment rate among males in the United States with a correlation coefficient (R) of -0.228 and weighted average of 6.2%, a difference of 19.0%.
Male Unemployment Correlation Summary
| Measurement | Syrian | Ecuadorian |
| Minimum | 0.70% | 1.7% |
| Maximum | 29.2% | 11.5% |
| Range | 28.5% | 9.8% |
| Mean | 6.1% | 6.1% |
| Median | 5.1% | 6.2% |
| Interquartile 25% (IQ1) | 3.7% | 5.2% |
| Interquartile 75% (IQ3) | 6.2% | 7.0% |
| Interquartile Range (IQR) | 2.5% | 1.8% |
| Standard Deviation (Sample) | 5.3% | 1.7% |
| Standard Deviation (Population) | 5.2% | 1.7% |
Similar Demographics by Male Unemployment
Demographics Similar to Syrians by Male Unemployment
In terms of male unemployment, the demographic groups most similar to Syrians are Sri Lankan (5.2%, a difference of 0.010%), Macedonian (5.2%, a difference of 0.020%), Fijian (5.2%, a difference of 0.030%), Immigrants from Kenya (5.2%, a difference of 0.030%), and Immigrants from Burma/Myanmar (5.2%, a difference of 0.040%).
| Demographics | Rating | Rank | Male Unemployment |
| Lebanese | 79.9 /100 | #136 | Good 5.2% |
| Immigrants | Eastern Africa | 79.8 /100 | #137 | Good 5.2% |
| Immigrants | Croatia | 79.7 /100 | #138 | Good 5.2% |
| Kenyans | 79.4 /100 | #139 | Good 5.2% |
| Brazilians | 79.3 /100 | #140 | Good 5.2% |
| Immigrants | Switzerland | 79.2 /100 | #141 | Good 5.2% |
| Fijians | 78.3 /100 | #142 | Good 5.2% |
| Syrians | 78.0 /100 | #143 | Good 5.2% |
| Sri Lankans | 77.9 /100 | #144 | Good 5.2% |
| Macedonians | 77.7 /100 | #145 | Good 5.2% |
| Immigrants | Kenya | 77.6 /100 | #146 | Good 5.2% |
| Immigrants | Burma/Myanmar | 77.5 /100 | #147 | Good 5.2% |
| Immigrants | Italy | 76.3 /100 | #148 | Good 5.2% |
| Immigrants | Europe | 76.2 /100 | #149 | Good 5.2% |
| Indians (Asian) | 76.0 /100 | #150 | Good 5.2% |
Demographics Similar to Ecuadorians by Male Unemployment
In terms of male unemployment, the demographic groups most similar to Ecuadorians are Immigrants from Western Africa (6.2%, a difference of 0.030%), Sierra Leonean (6.2%, a difference of 0.43%), Immigrants from Ghana (6.2%, a difference of 0.50%), Spanish American Indian (6.2%, a difference of 0.68%), and Immigrants from Ecuador (6.2%, a difference of 0.70%).
| Demographics | Rating | Rank | Male Unemployment |
| Menominee | 0.0 /100 | #275 | Tragic 6.0% |
| Tlingit-Haida | 0.0 /100 | #276 | Tragic 6.0% |
| Immigrants | Liberia | 0.0 /100 | #277 | Tragic 6.1% |
| Immigrants | Fiji | 0.0 /100 | #278 | Tragic 6.1% |
| Ghanaians | 0.0 /100 | #279 | Tragic 6.1% |
| Immigrants | Ghana | 0.0 /100 | #280 | Tragic 6.2% |
| Sierra Leoneans | 0.0 /100 | #281 | Tragic 6.2% |
| Ecuadorians | 0.0 /100 | #282 | Tragic 6.2% |
| Immigrants | Western Africa | 0.0 /100 | #283 | Tragic 6.2% |
| Spanish American Indians | 0.0 /100 | #284 | Tragic 6.2% |
| Immigrants | Ecuador | 0.0 /100 | #285 | Tragic 6.2% |
| Africans | 0.0 /100 | #286 | Tragic 6.3% |
| Central American Indians | 0.0 /100 | #287 | Tragic 6.3% |
| Immigrants | Senegal | 0.0 /100 | #288 | Tragic 6.3% |
| Immigrants | Caribbean | 0.0 /100 | #289 | Tragic 6.3% |