Syrian vs Ethiopian Male Unemployment
COMPARE
Syrian
Ethiopian
Male Unemployment
Male Unemployment Comparison
Syrians
Ethiopians
5.2%
MALE UNEMPLOYMENT
78.0/ 100
METRIC RATING
143rd/ 347
METRIC RANK
5.1%
MALE UNEMPLOYMENT
91.3/ 100
METRIC RATING
107th/ 347
METRIC RANK
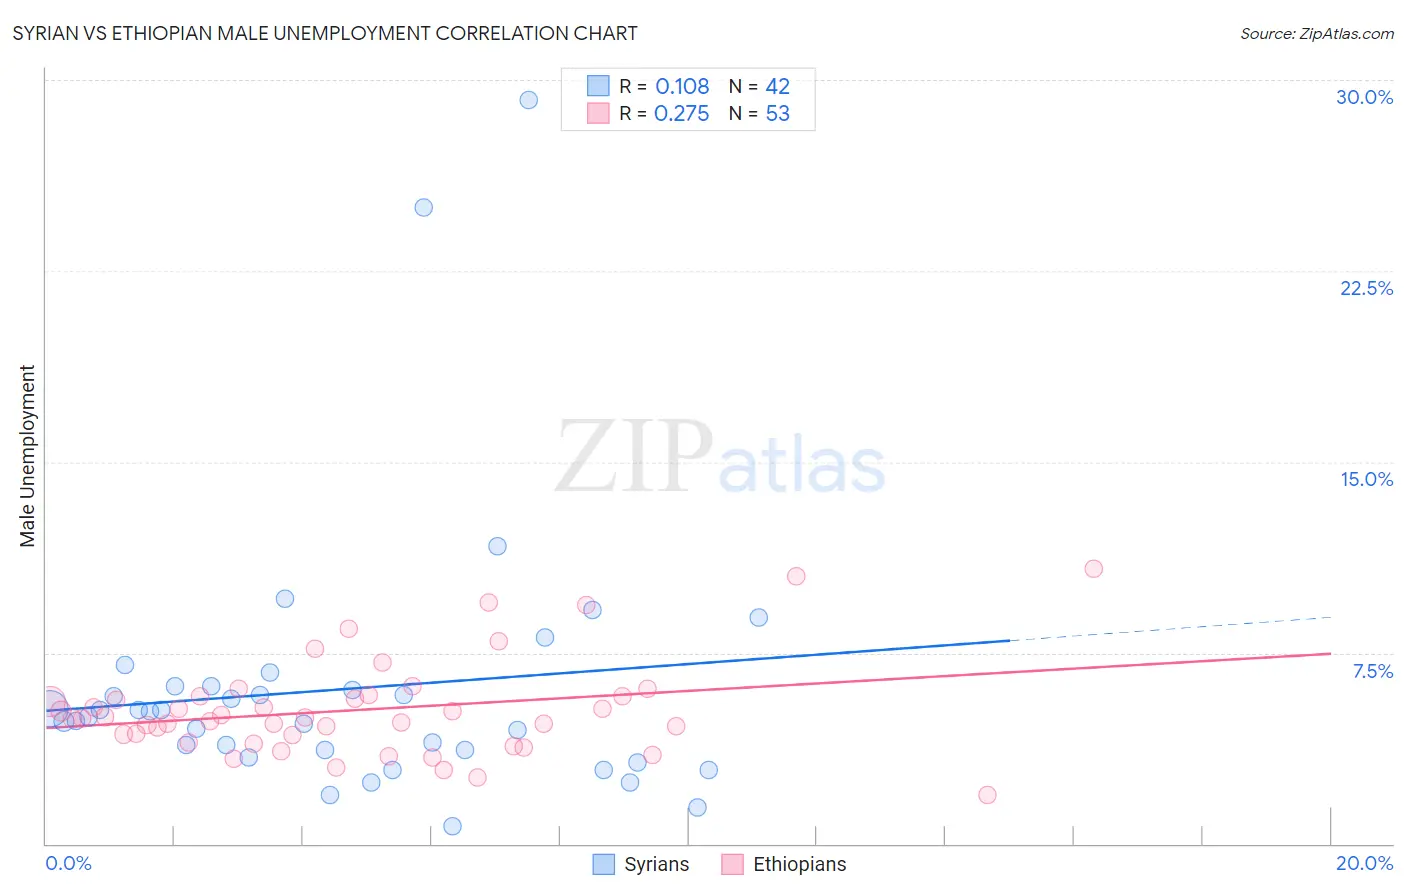
Syrian vs Ethiopian Male Unemployment Correlation Chart
The statistical analysis conducted on geographies consisting of 265,748,464 people shows a poor positive correlation between the proportion of Syrians and unemployment rate among males in the United States with a correlation coefficient (R) of 0.108 and weighted average of 5.2%. Similarly, the statistical analysis conducted on geographies consisting of 222,844,986 people shows a weak positive correlation between the proportion of Ethiopians and unemployment rate among males in the United States with a correlation coefficient (R) of 0.275 and weighted average of 5.1%, a difference of 1.6%.
Male Unemployment Correlation Summary
| Measurement | Syrian | Ethiopian |
| Minimum | 0.70% | 1.9% |
| Maximum | 29.2% | 10.8% |
| Range | 28.5% | 8.9% |
| Mean | 6.1% | 5.3% |
| Median | 5.1% | 4.9% |
| Interquartile 25% (IQ1) | 3.7% | 4.1% |
| Interquartile 75% (IQ3) | 6.2% | 5.8% |
| Interquartile Range (IQR) | 2.5% | 1.7% |
| Standard Deviation (Sample) | 5.3% | 1.9% |
| Standard Deviation (Population) | 5.2% | 1.9% |
Similar Demographics by Male Unemployment
Demographics Similar to Syrians by Male Unemployment
In terms of male unemployment, the demographic groups most similar to Syrians are Sri Lankan (5.2%, a difference of 0.010%), Macedonian (5.2%, a difference of 0.020%), Fijian (5.2%, a difference of 0.030%), Immigrants from Kenya (5.2%, a difference of 0.030%), and Immigrants from Burma/Myanmar (5.2%, a difference of 0.040%).
| Demographics | Rating | Rank | Male Unemployment |
| Lebanese | 79.9 /100 | #136 | Good 5.2% |
| Immigrants | Eastern Africa | 79.8 /100 | #137 | Good 5.2% |
| Immigrants | Croatia | 79.7 /100 | #138 | Good 5.2% |
| Kenyans | 79.4 /100 | #139 | Good 5.2% |
| Brazilians | 79.3 /100 | #140 | Good 5.2% |
| Immigrants | Switzerland | 79.2 /100 | #141 | Good 5.2% |
| Fijians | 78.3 /100 | #142 | Good 5.2% |
| Syrians | 78.0 /100 | #143 | Good 5.2% |
| Sri Lankans | 77.9 /100 | #144 | Good 5.2% |
| Macedonians | 77.7 /100 | #145 | Good 5.2% |
| Immigrants | Kenya | 77.6 /100 | #146 | Good 5.2% |
| Immigrants | Burma/Myanmar | 77.5 /100 | #147 | Good 5.2% |
| Immigrants | Italy | 76.3 /100 | #148 | Good 5.2% |
| Immigrants | Europe | 76.2 /100 | #149 | Good 5.2% |
| Indians (Asian) | 76.0 /100 | #150 | Good 5.2% |
Demographics Similar to Ethiopians by Male Unemployment
In terms of male unemployment, the demographic groups most similar to Ethiopians are Immigrants from Nicaragua (5.1%, a difference of 0.010%), Immigrants from Ethiopia (5.1%, a difference of 0.040%), Immigrants from Pakistan (5.1%, a difference of 0.070%), Immigrants from Czechoslovakia (5.1%, a difference of 0.080%), and Immigrants from Chile (5.1%, a difference of 0.090%).
| Demographics | Rating | Rank | Male Unemployment |
| Russians | 92.9 /100 | #100 | Exceptional 5.1% |
| German Russians | 92.7 /100 | #101 | Exceptional 5.1% |
| Immigrants | France | 92.7 /100 | #102 | Exceptional 5.1% |
| Immigrants | Jordan | 91.9 /100 | #103 | Exceptional 5.1% |
| Immigrants | Chile | 91.8 /100 | #104 | Exceptional 5.1% |
| Immigrants | Czechoslovakia | 91.7 /100 | #105 | Exceptional 5.1% |
| Immigrants | Ethiopia | 91.5 /100 | #106 | Exceptional 5.1% |
| Ethiopians | 91.3 /100 | #107 | Exceptional 5.1% |
| Immigrants | Nicaragua | 91.2 /100 | #108 | Exceptional 5.1% |
| Immigrants | Pakistan | 90.9 /100 | #109 | Exceptional 5.1% |
| Immigrants | England | 90.8 /100 | #110 | Exceptional 5.1% |
| Immigrants | Eastern Asia | 90.8 /100 | #111 | Exceptional 5.1% |
| Immigrants | Moldova | 90.3 /100 | #112 | Exceptional 5.1% |
| Immigrants | Austria | 90.3 /100 | #113 | Exceptional 5.1% |
| Romanians | 89.8 /100 | #114 | Excellent 5.1% |