Sudanese vs Immigrants from Germany Unemployment Among Women with Children Ages 6 to 17 years
COMPARE
Sudanese
Immigrants from Germany
Unemployment Among Women with Children Ages 6 to 17 years
Unemployment Among Women with Children Ages 6 to 17 years Comparison
Sudanese
Immigrants from Germany
7.4%
UNEMPLOYMENT AMONG WOMEN WITH CHILDREN AGES 6 TO 17 YEARS
100.0/ 100
METRIC RATING
14th/ 347
METRIC RANK
9.2%
UNEMPLOYMENT AMONG WOMEN WITH CHILDREN AGES 6 TO 17 YEARS
7.2/ 100
METRIC RATING
215th/ 347
METRIC RANK
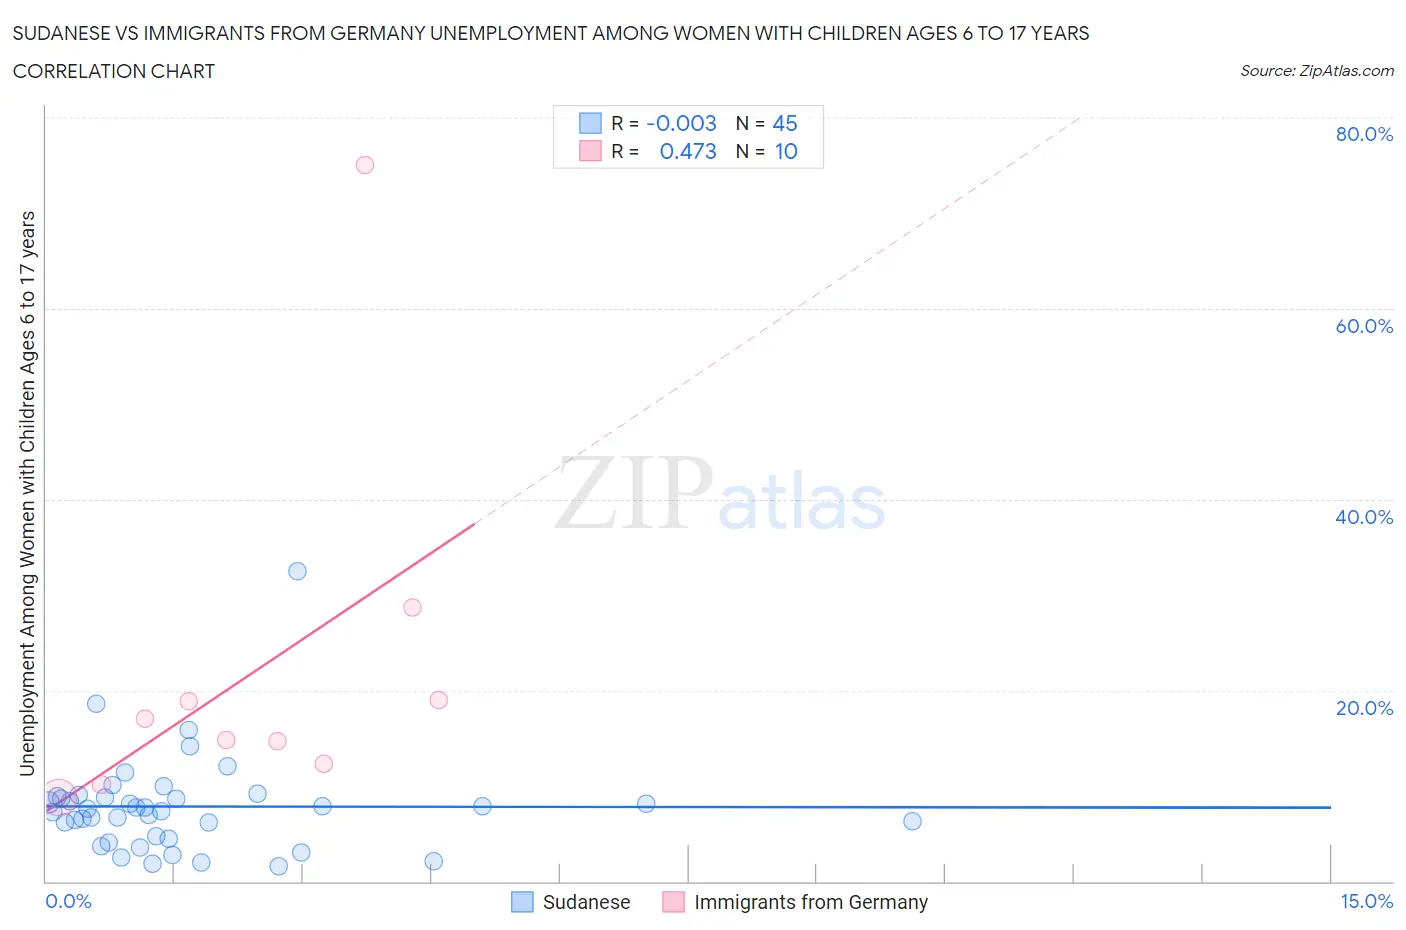
Sudanese vs Immigrants from Germany Unemployment Among Women with Children Ages 6 to 17 years Correlation Chart
The statistical analysis conducted on geographies consisting of 98,187,215 people shows no correlation between the proportion of Sudanese and unemployment rate among women with children between the ages 6 and 17 in the United States with a correlation coefficient (R) of -0.003 and weighted average of 7.4%. Similarly, the statistical analysis conducted on geographies consisting of 317,293,448 people shows a moderate positive correlation between the proportion of Immigrants from Germany and unemployment rate among women with children between the ages 6 and 17 in the United States with a correlation coefficient (R) of 0.473 and weighted average of 9.2%, a difference of 24.4%.
Unemployment Among Women with Children Ages 6 to 17 years Correlation Summary
| Measurement | Sudanese | Immigrants from Germany |
| Minimum | 1.6% | 8.7% |
| Maximum | 32.5% | 75.1% |
| Range | 30.9% | 66.3% |
| Mean | 7.8% | 21.9% |
| Median | 7.5% | 15.9% |
| Interquartile 25% (IQ1) | 4.6% | 12.3% |
| Interquartile 75% (IQ3) | 8.8% | 19.0% |
| Interquartile Range (IQR) | 4.2% | 6.7% |
| Standard Deviation (Sample) | 5.2% | 19.5% |
| Standard Deviation (Population) | 5.1% | 18.5% |
Similar Demographics by Unemployment Among Women with Children Ages 6 to 17 years
Demographics Similar to Sudanese by Unemployment Among Women with Children Ages 6 to 17 years
In terms of unemployment among women with children ages 6 to 17 years, the demographic groups most similar to Sudanese are Indonesian (7.4%, a difference of 0.040%), Bangladeshi (7.4%, a difference of 0.75%), Puget Sound Salish (7.5%, a difference of 1.1%), Immigrants from Taiwan (7.3%, a difference of 1.1%), and Immigrants from Burma/Myanmar (7.5%, a difference of 1.4%).
| Demographics | Rating | Rank | Unemployment Among Women with Children Ages 6 to 17 years |
| Soviet Union | 100.0 /100 | #7 | Exceptional 7.1% |
| Immigrants | Hong Kong | 100.0 /100 | #8 | Exceptional 7.2% |
| Assyrians/Chaldeans/Syriacs | 100.0 /100 | #9 | Exceptional 7.2% |
| Immigrants | Fiji | 100.0 /100 | #10 | Exceptional 7.3% |
| Immigrants | Taiwan | 100.0 /100 | #11 | Exceptional 7.3% |
| Bangladeshis | 100.0 /100 | #12 | Exceptional 7.4% |
| Indonesians | 100.0 /100 | #13 | Exceptional 7.4% |
| Sudanese | 100.0 /100 | #14 | Exceptional 7.4% |
| Puget Sound Salish | 100.0 /100 | #15 | Exceptional 7.5% |
| Immigrants | Burma/Myanmar | 100.0 /100 | #16 | Exceptional 7.5% |
| Cambodians | 100.0 /100 | #17 | Exceptional 7.5% |
| Afghans | 100.0 /100 | #18 | Exceptional 7.6% |
| Filipinos | 100.0 /100 | #19 | Exceptional 7.6% |
| Immigrants | Singapore | 100.0 /100 | #20 | Exceptional 7.7% |
| Immigrants | India | 100.0 /100 | #21 | Exceptional 7.7% |
Demographics Similar to Immigrants from Germany by Unemployment Among Women with Children Ages 6 to 17 years
In terms of unemployment among women with children ages 6 to 17 years, the demographic groups most similar to Immigrants from Germany are Immigrants from Uruguay (9.2%, a difference of 0.0%), German (9.2%, a difference of 0.010%), Iroquois (9.2%, a difference of 0.040%), Syrian (9.2%, a difference of 0.060%), and Immigrants from Scotland (9.2%, a difference of 0.11%).
| Demographics | Rating | Rank | Unemployment Among Women with Children Ages 6 to 17 years |
| Immigrants | Peru | 10.8 /100 | #208 | Poor 9.2% |
| Salvadorans | 10.7 /100 | #209 | Poor 9.2% |
| Finns | 10.0 /100 | #210 | Tragic 9.2% |
| Immigrants | Cuba | 9.6 /100 | #211 | Tragic 9.2% |
| Peruvians | 9.0 /100 | #212 | Tragic 9.2% |
| Spaniards | 8.2 /100 | #213 | Tragic 9.2% |
| Iroquois | 7.5 /100 | #214 | Tragic 9.2% |
| Immigrants | Germany | 7.2 /100 | #215 | Tragic 9.2% |
| Immigrants | Uruguay | 7.2 /100 | #216 | Tragic 9.2% |
| Germans | 7.2 /100 | #217 | Tragic 9.2% |
| Syrians | 6.9 /100 | #218 | Tragic 9.2% |
| Immigrants | Scotland | 6.6 /100 | #219 | Tragic 9.2% |
| Belgians | 6.4 /100 | #220 | Tragic 9.2% |
| Crow | 5.8 /100 | #221 | Tragic 9.2% |
| Immigrants | Southern Europe | 5.8 /100 | #222 | Tragic 9.2% |