Sudanese vs Pima Unemployment Among Women with Children Ages 6 to 17 years
COMPARE
Sudanese
Pima
Unemployment Among Women with Children Ages 6 to 17 years
Unemployment Among Women with Children Ages 6 to 17 years Comparison
Sudanese
Pima
7.4%
UNEMPLOYMENT AMONG WOMEN WITH CHILDREN AGES 6 TO 17 YEARS
100.0/ 100
METRIC RATING
14th/ 347
METRIC RANK
18.9%
UNEMPLOYMENT AMONG WOMEN WITH CHILDREN AGES 6 TO 17 YEARS
0.0/ 100
METRIC RATING
347th/ 347
METRIC RANK
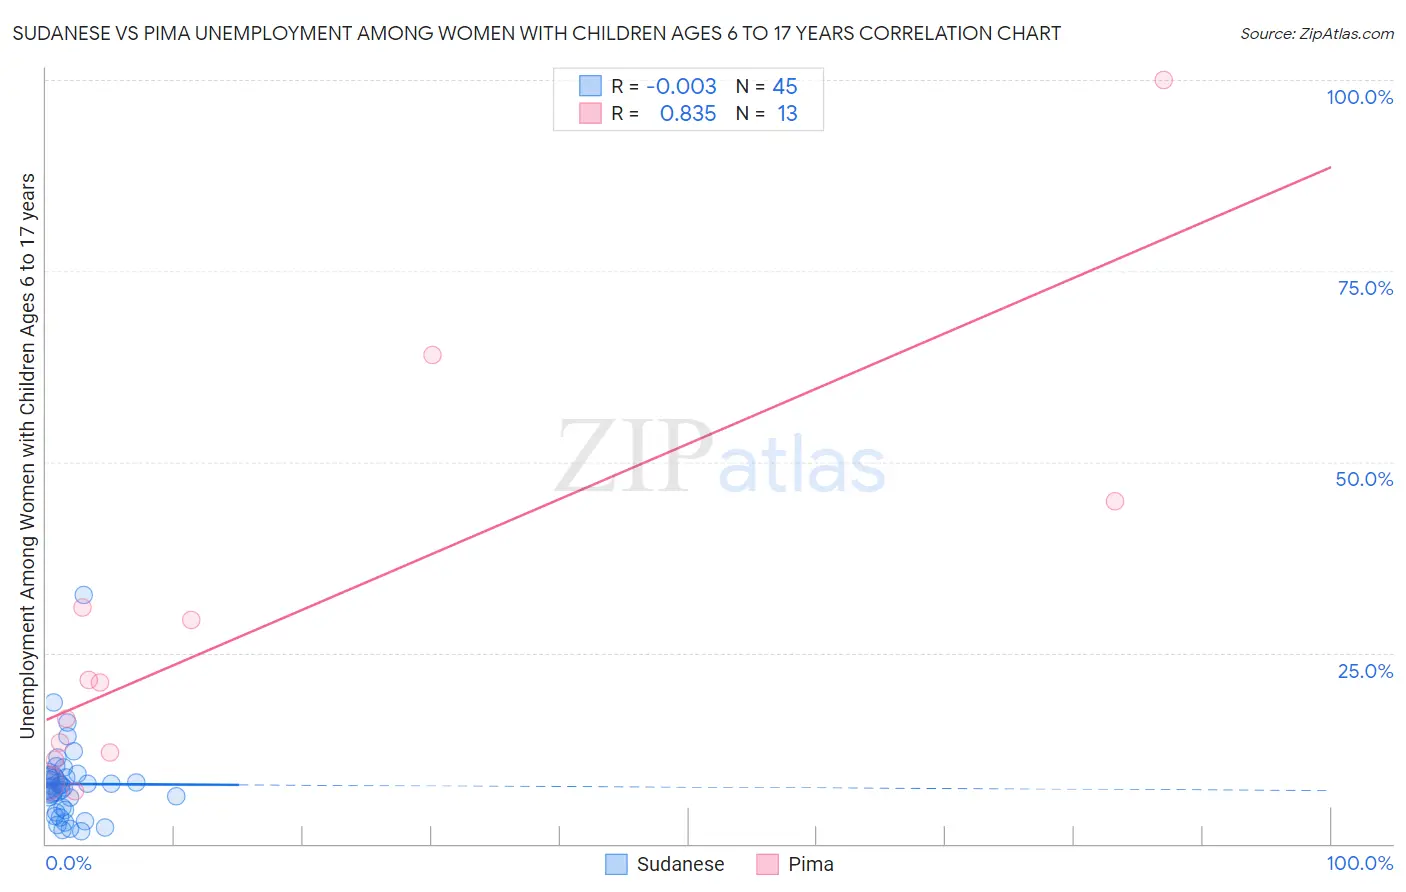
Sudanese vs Pima Unemployment Among Women with Children Ages 6 to 17 years Correlation Chart
The statistical analysis conducted on geographies consisting of 98,187,215 people shows no correlation between the proportion of Sudanese and unemployment rate among women with children between the ages 6 and 17 in the United States with a correlation coefficient (R) of -0.003 and weighted average of 7.4%. Similarly, the statistical analysis conducted on geographies consisting of 57,470,854 people shows a very strong positive correlation between the proportion of Pima and unemployment rate among women with children between the ages 6 and 17 in the United States with a correlation coefficient (R) of 0.835 and weighted average of 18.9%, a difference of 154.8%.
Unemployment Among Women with Children Ages 6 to 17 years Correlation Summary
| Measurement | Sudanese | Pima |
| Minimum | 1.6% | 6.8% |
| Maximum | 32.5% | 100.0% |
| Range | 30.9% | 93.2% |
| Mean | 7.8% | 29.2% |
| Median | 7.5% | 21.2% |
| Interquartile 25% (IQ1) | 4.6% | 11.5% |
| Interquartile 75% (IQ3) | 8.8% | 37.9% |
| Interquartile Range (IQR) | 4.2% | 26.4% |
| Standard Deviation (Sample) | 5.2% | 26.8% |
| Standard Deviation (Population) | 5.1% | 25.7% |
Similar Demographics by Unemployment Among Women with Children Ages 6 to 17 years
Demographics Similar to Sudanese by Unemployment Among Women with Children Ages 6 to 17 years
In terms of unemployment among women with children ages 6 to 17 years, the demographic groups most similar to Sudanese are Indonesian (7.4%, a difference of 0.040%), Bangladeshi (7.4%, a difference of 0.75%), Puget Sound Salish (7.5%, a difference of 1.1%), Immigrants from Taiwan (7.3%, a difference of 1.1%), and Immigrants from Burma/Myanmar (7.5%, a difference of 1.4%).
| Demographics | Rating | Rank | Unemployment Among Women with Children Ages 6 to 17 years |
| Soviet Union | 100.0 /100 | #7 | Exceptional 7.1% |
| Immigrants | Hong Kong | 100.0 /100 | #8 | Exceptional 7.2% |
| Assyrians/Chaldeans/Syriacs | 100.0 /100 | #9 | Exceptional 7.2% |
| Immigrants | Fiji | 100.0 /100 | #10 | Exceptional 7.3% |
| Immigrants | Taiwan | 100.0 /100 | #11 | Exceptional 7.3% |
| Bangladeshis | 100.0 /100 | #12 | Exceptional 7.4% |
| Indonesians | 100.0 /100 | #13 | Exceptional 7.4% |
| Sudanese | 100.0 /100 | #14 | Exceptional 7.4% |
| Puget Sound Salish | 100.0 /100 | #15 | Exceptional 7.5% |
| Immigrants | Burma/Myanmar | 100.0 /100 | #16 | Exceptional 7.5% |
| Cambodians | 100.0 /100 | #17 | Exceptional 7.5% |
| Afghans | 100.0 /100 | #18 | Exceptional 7.6% |
| Filipinos | 100.0 /100 | #19 | Exceptional 7.6% |
| Immigrants | Singapore | 100.0 /100 | #20 | Exceptional 7.7% |
| Immigrants | India | 100.0 /100 | #21 | Exceptional 7.7% |
Demographics Similar to Pima by Unemployment Among Women with Children Ages 6 to 17 years
In terms of unemployment among women with children ages 6 to 17 years, the demographic groups most similar to Pima are Yup'ik (18.6%, a difference of 1.4%), Arapaho (16.8%, a difference of 12.0%), Cheyenne (16.4%, a difference of 15.2%), Inupiat (14.9%, a difference of 27.1%), and Yuman (14.8%, a difference of 27.5%).
| Demographics | Rating | Rank | Unemployment Among Women with Children Ages 6 to 17 years |
| Natives/Alaskans | 0.0 /100 | #333 | Tragic 11.5% |
| Ugandans | 0.0 /100 | #334 | Tragic 12.0% |
| Colville | 0.0 /100 | #335 | Tragic 12.3% |
| Houma | 0.0 /100 | #336 | Tragic 12.5% |
| Immigrants | Yemen | 0.0 /100 | #337 | Tragic 12.7% |
| Hopi | 0.0 /100 | #338 | Tragic 12.9% |
| Sioux | 0.0 /100 | #339 | Tragic 13.2% |
| Puerto Ricans | 0.0 /100 | #340 | Tragic 13.9% |
| Navajo | 0.0 /100 | #341 | Tragic 14.2% |
| Yuman | 0.0 /100 | #342 | Tragic 14.8% |
| Inupiat | 0.0 /100 | #343 | Tragic 14.9% |
| Cheyenne | 0.0 /100 | #344 | Tragic 16.4% |
| Arapaho | 0.0 /100 | #345 | Tragic 16.8% |
| Yup'ik | 0.0 /100 | #346 | Tragic 18.6% |
| Pima | 0.0 /100 | #347 | Tragic 18.9% |