Scotch-Irish vs Immigrants from Denmark Unemployment Among Ages 35 to 44 years
COMPARE
Scotch-Irish
Immigrants from Denmark
Unemployment Among Ages 35 to 44 years
Unemployment Among Ages 35 to 44 years Comparison
Scotch-Irish
Immigrants from Denmark
4.6%
UNEMPLOYMENT AMONG AGES 35 TO 44 YEARS
79.3/ 100
METRIC RATING
136th/ 347
METRIC RANK
4.6%
UNEMPLOYMENT AMONG AGES 35 TO 44 YEARS
74.4/ 100
METRIC RATING
146th/ 347
METRIC RANK
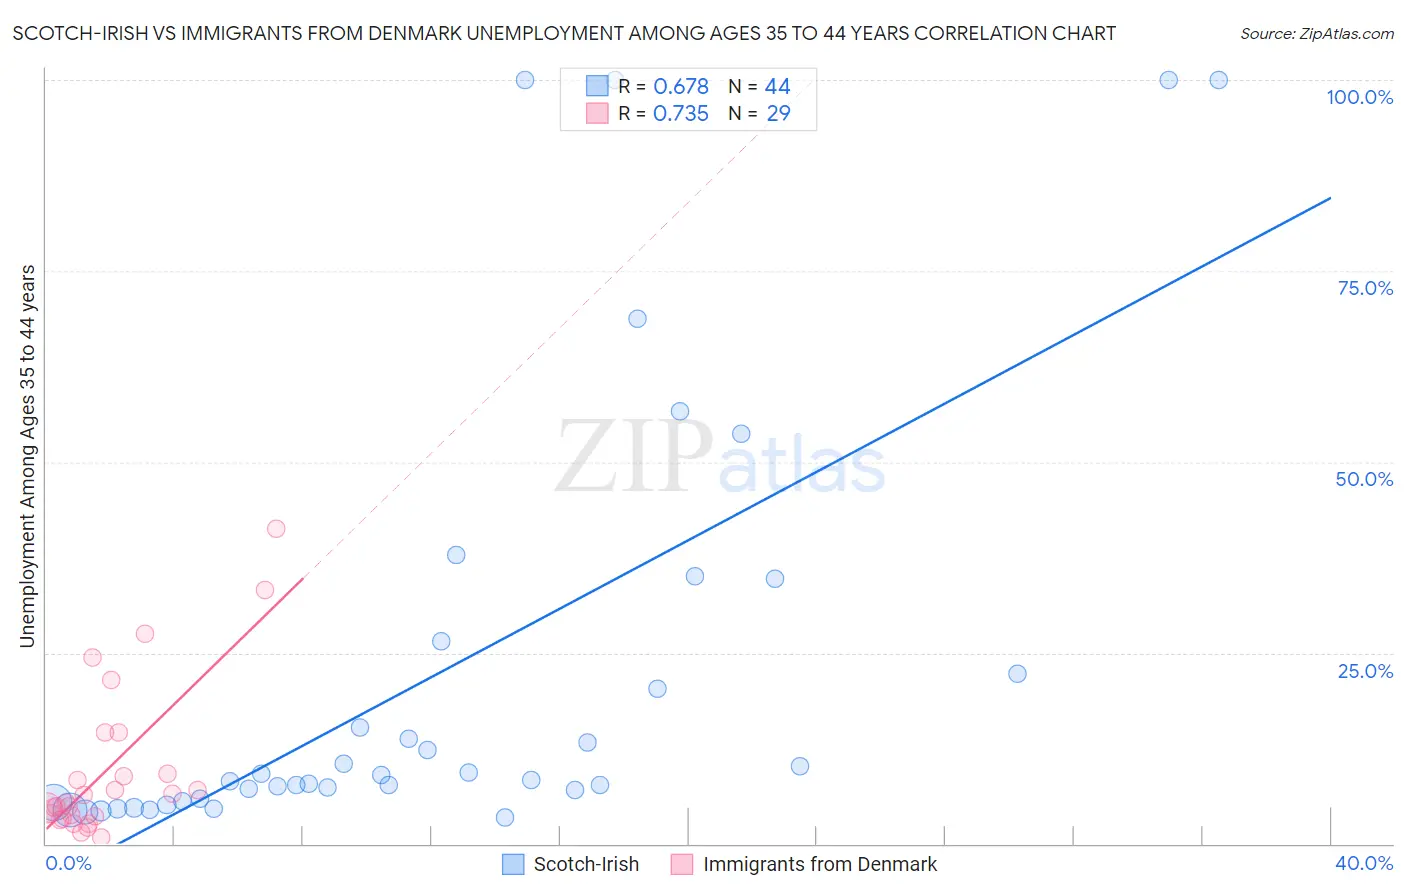
Scotch-Irish vs Immigrants from Denmark Unemployment Among Ages 35 to 44 years Correlation Chart
The statistical analysis conducted on geographies consisting of 513,888,512 people shows a significant positive correlation between the proportion of Scotch-Irish and unemployment rate among population between the ages 35 and 44 in the United States with a correlation coefficient (R) of 0.678 and weighted average of 4.6%. Similarly, the statistical analysis conducted on geographies consisting of 134,898,845 people shows a strong positive correlation between the proportion of Immigrants from Denmark and unemployment rate among population between the ages 35 and 44 in the United States with a correlation coefficient (R) of 0.735 and weighted average of 4.6%, a difference of 0.50%.
Unemployment Among Ages 35 to 44 years Correlation Summary
| Measurement | Scotch-Irish | Immigrants from Denmark |
| Minimum | 3.5% | 0.80% |
| Maximum | 100.0% | 41.2% |
| Range | 96.5% | 40.4% |
| Mean | 22.5% | 9.7% |
| Median | 8.6% | 5.5% |
| Interquartile 25% (IQ1) | 5.8% | 3.4% |
| Interquartile 75% (IQ3) | 24.4% | 11.8% |
| Interquartile Range (IQR) | 18.6% | 8.4% |
| Standard Deviation (Sample) | 28.9% | 10.2% |
| Standard Deviation (Population) | 28.6% | 10.0% |
Demographics Similar to Scotch-Irish and Immigrants from Denmark by Unemployment Among Ages 35 to 44 years
In terms of unemployment among ages 35 to 44 years, the demographic groups most similar to Scotch-Irish are Immigrants from Europe (4.6%, a difference of 0.010%), Immigrants from Iraq (4.6%, a difference of 0.040%), Laotian (4.6%, a difference of 0.090%), Syrian (4.6%, a difference of 0.16%), and Colombian (4.6%, a difference of 0.17%). Similarly, the demographic groups most similar to Immigrants from Denmark are Immigrants from Eastern Europe (4.6%, a difference of 0.020%), Immigrants from Vietnam (4.6%, a difference of 0.060%), Immigrants from Switzerland (4.6%, a difference of 0.10%), Immigrants from Russia (4.6%, a difference of 0.10%), and Ukrainian (4.6%, a difference of 0.13%).
| Demographics | Rating | Rank | Unemployment Among Ages 35 to 44 years |
| Immigrants | Colombia | 82.6 /100 | #131 | Excellent 4.6% |
| Colombians | 80.8 /100 | #132 | Excellent 4.6% |
| Syrians | 80.7 /100 | #133 | Excellent 4.6% |
| Laotians | 80.1 /100 | #134 | Excellent 4.6% |
| Immigrants | Europe | 79.4 /100 | #135 | Good 4.6% |
| Scotch-Irish | 79.3 /100 | #136 | Good 4.6% |
| Immigrants | Iraq | 78.9 /100 | #137 | Good 4.6% |
| Immigrants | Norway | 77.5 /100 | #138 | Good 4.6% |
| Immigrants | Hungary | 76.3 /100 | #139 | Good 4.6% |
| Immigrants | Eastern Africa | 76.0 /100 | #140 | Good 4.6% |
| Canadians | 75.9 /100 | #141 | Good 4.6% |
| Ukrainians | 75.8 /100 | #142 | Good 4.6% |
| Immigrants | Switzerland | 75.5 /100 | #143 | Good 4.6% |
| Immigrants | Russia | 75.4 /100 | #144 | Good 4.6% |
| Immigrants | Eastern Europe | 74.7 /100 | #145 | Good 4.6% |
| Immigrants | Denmark | 74.4 /100 | #146 | Good 4.6% |
| Immigrants | Vietnam | 73.8 /100 | #147 | Good 4.6% |
| Slavs | 72.4 /100 | #148 | Good 4.6% |
| Immigrants | Burma/Myanmar | 72.2 /100 | #149 | Good 4.6% |
| Immigrants | England | 70.5 /100 | #150 | Good 4.6% |
| Puget Sound Salish | 67.1 /100 | #151 | Good 4.6% |