Immigrants from Eastern Asia vs Subsaharan African Unemployment Among Ages 35 to 44 years
COMPARE
Immigrants from Eastern Asia
Subsaharan African
Unemployment Among Ages 35 to 44 years
Unemployment Among Ages 35 to 44 years Comparison
Immigrants from Eastern Asia
Sub-Saharan Africans
4.4%
UNEMPLOYMENT AMONG AGES 35 TO 44 YEARS
97.8/ 100
METRIC RATING
51st/ 347
METRIC RANK
5.3%
UNEMPLOYMENT AMONG AGES 35 TO 44 YEARS
0.1/ 100
METRIC RATING
260th/ 347
METRIC RANK
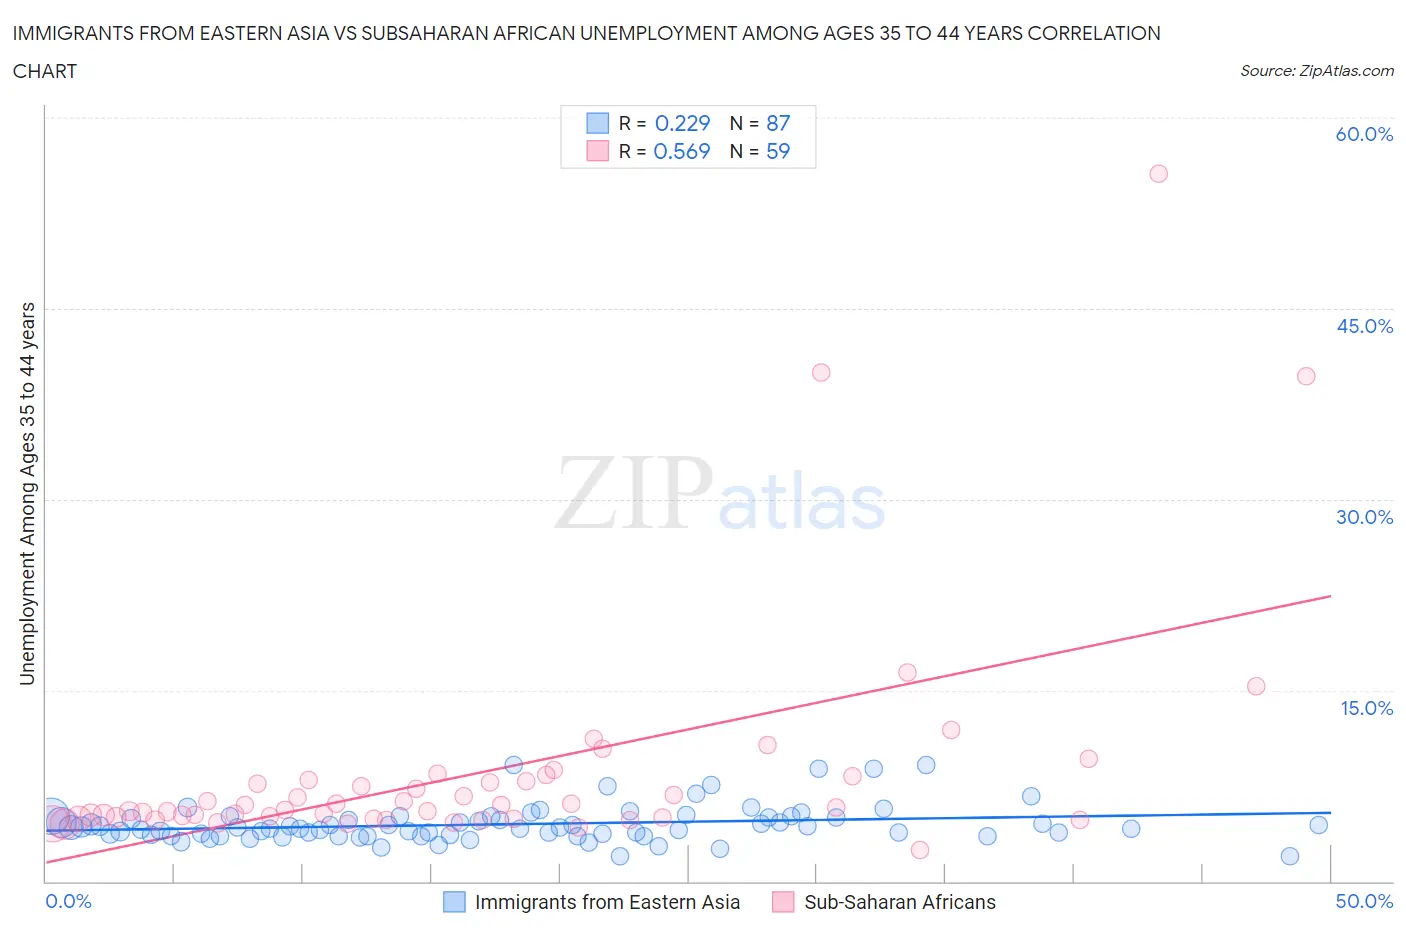
Immigrants from Eastern Asia vs Subsaharan African Unemployment Among Ages 35 to 44 years Correlation Chart
The statistical analysis conducted on geographies consisting of 481,023,005 people shows a weak positive correlation between the proportion of Immigrants from Eastern Asia and unemployment rate among population between the ages 35 and 44 in the United States with a correlation coefficient (R) of 0.229 and weighted average of 4.4%. Similarly, the statistical analysis conducted on geographies consisting of 489,916,914 people shows a substantial positive correlation between the proportion of Sub-Saharan Africans and unemployment rate among population between the ages 35 and 44 in the United States with a correlation coefficient (R) of 0.569 and weighted average of 5.3%, a difference of 20.4%.
Unemployment Among Ages 35 to 44 years Correlation Summary
| Measurement | Immigrants from Eastern Asia | Subsaharan African |
| Minimum | 1.9% | 2.5% |
| Maximum | 9.1% | 55.6% |
| Range | 7.2% | 53.1% |
| Mean | 4.5% | 8.6% |
| Median | 4.2% | 5.8% |
| Interquartile 25% (IQ1) | 3.6% | 4.9% |
| Interquartile 75% (IQ3) | 5.0% | 7.9% |
| Interquartile Range (IQR) | 1.4% | 3.0% |
| Standard Deviation (Sample) | 1.4% | 9.1% |
| Standard Deviation (Population) | 1.4% | 9.0% |
Similar Demographics by Unemployment Among Ages 35 to 44 years
Demographics Similar to Immigrants from Eastern Asia by Unemployment Among Ages 35 to 44 years
In terms of unemployment among ages 35 to 44 years, the demographic groups most similar to Immigrants from Eastern Asia are Immigrants from Turkey (4.4%, a difference of 0.020%), Okinawan (4.4%, a difference of 0.020%), Immigrants from Argentina (4.4%, a difference of 0.16%), Asian (4.4%, a difference of 0.32%), and Immigrants from Moldova (4.4%, a difference of 0.35%).
| Demographics | Rating | Rank | Unemployment Among Ages 35 to 44 years |
| Immigrants | Malaysia | 98.7 /100 | #44 | Exceptional 4.3% |
| Immigrants | Korea | 98.4 /100 | #45 | Exceptional 4.3% |
| Immigrants | Belgium | 98.4 /100 | #46 | Exceptional 4.3% |
| British | 98.3 /100 | #47 | Exceptional 4.4% |
| Bhutanese | 98.2 /100 | #48 | Exceptional 4.4% |
| Swiss | 98.2 /100 | #49 | Exceptional 4.4% |
| Immigrants | Turkey | 97.8 /100 | #50 | Exceptional 4.4% |
| Immigrants | Eastern Asia | 97.8 /100 | #51 | Exceptional 4.4% |
| Okinawans | 97.7 /100 | #52 | Exceptional 4.4% |
| Immigrants | Argentina | 97.6 /100 | #53 | Exceptional 4.4% |
| Asians | 97.4 /100 | #54 | Exceptional 4.4% |
| Immigrants | Moldova | 97.3 /100 | #55 | Exceptional 4.4% |
| Chileans | 97.3 /100 | #56 | Exceptional 4.4% |
| Immigrants | Hong Kong | 97.2 /100 | #57 | Exceptional 4.4% |
| English | 97.2 /100 | #58 | Exceptional 4.4% |
Demographics Similar to Sub-Saharan Africans by Unemployment Among Ages 35 to 44 years
In terms of unemployment among ages 35 to 44 years, the demographic groups most similar to Sub-Saharan Africans are Mexican (5.3%, a difference of 0.030%), Immigrants from Latin America (5.3%, a difference of 0.13%), Spanish American (5.3%, a difference of 0.20%), Immigrants from Fiji (5.3%, a difference of 0.25%), and Seminole (5.2%, a difference of 0.53%).
| Demographics | Rating | Rank | Unemployment Among Ages 35 to 44 years |
| Mexican American Indians | 0.2 /100 | #253 | Tragic 5.2% |
| Immigrants | Bahamas | 0.2 /100 | #254 | Tragic 5.2% |
| Cherokee | 0.2 /100 | #255 | Tragic 5.2% |
| Seminole | 0.1 /100 | #256 | Tragic 5.2% |
| Immigrants | Fiji | 0.1 /100 | #257 | Tragic 5.3% |
| Immigrants | Latin America | 0.1 /100 | #258 | Tragic 5.3% |
| Mexicans | 0.1 /100 | #259 | Tragic 5.3% |
| Sub-Saharan Africans | 0.1 /100 | #260 | Tragic 5.3% |
| Spanish Americans | 0.1 /100 | #261 | Tragic 5.3% |
| Immigrants | Central America | 0.1 /100 | #262 | Tragic 5.3% |
| Choctaw | 0.1 /100 | #263 | Tragic 5.3% |
| Ghanaians | 0.1 /100 | #264 | Tragic 5.3% |
| Yaqui | 0.1 /100 | #265 | Tragic 5.3% |
| Immigrants | Bangladesh | 0.1 /100 | #266 | Tragic 5.3% |
| Immigrants | Western Africa | 0.0 /100 | #267 | Tragic 5.3% |