Peruvian vs Pakistani Unemployment Among Women with Children Under 6 years
COMPARE
Peruvian
Pakistani
Unemployment Among Women with Children Under 6 years
Unemployment Among Women with Children Under 6 years Comparison
Peruvians
Pakistanis
7.5%
UNEMPLOYMENT AMONG WOMEN WITH CHILDREN UNDER 6 YEARS
72.3/ 100
METRIC RATING
157th/ 347
METRIC RANK
7.3%
UNEMPLOYMENT AMONG WOMEN WITH CHILDREN UNDER 6 YEARS
92.2/ 100
METRIC RATING
125th/ 347
METRIC RANK
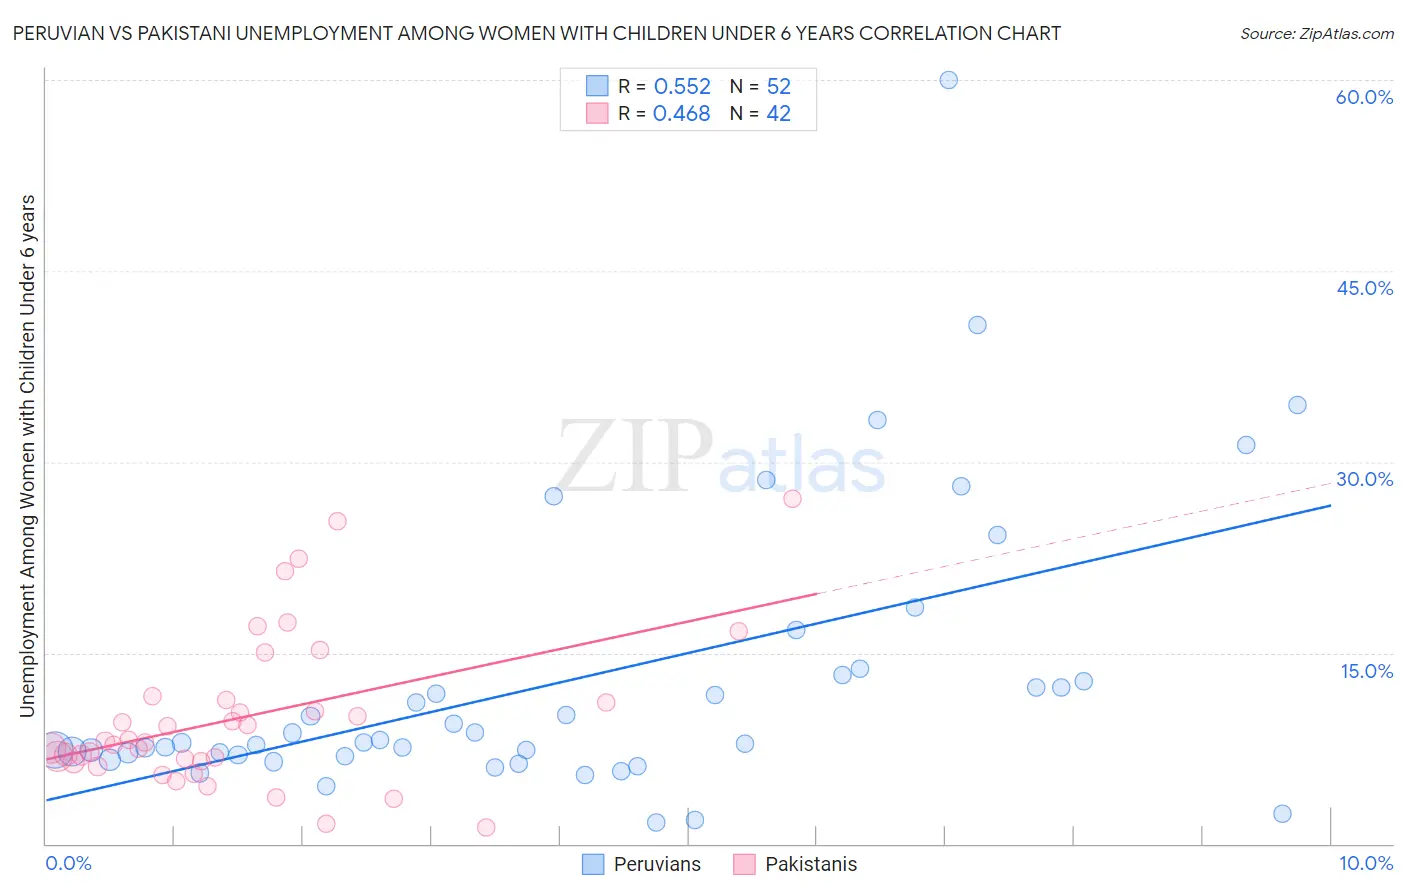
Peruvian vs Pakistani Unemployment Among Women with Children Under 6 years Correlation Chart
The statistical analysis conducted on geographies consisting of 286,643,171 people shows a substantial positive correlation between the proportion of Peruvians and unemployment rate among women with children under the age of 6 in the United States with a correlation coefficient (R) of 0.552 and weighted average of 7.5%. Similarly, the statistical analysis conducted on geographies consisting of 266,898,941 people shows a moderate positive correlation between the proportion of Pakistanis and unemployment rate among women with children under the age of 6 in the United States with a correlation coefficient (R) of 0.468 and weighted average of 7.3%, a difference of 2.6%.
Unemployment Among Women with Children Under 6 years Correlation Summary
| Measurement | Peruvian | Pakistani |
| Minimum | 1.7% | 1.3% |
| Maximum | 60.0% | 27.1% |
| Range | 58.3% | 25.8% |
| Mean | 12.8% | 10.0% |
| Median | 7.9% | 8.0% |
| Interquartile 25% (IQ1) | 6.9% | 6.5% |
| Interquartile 75% (IQ3) | 13.1% | 11.3% |
| Interquartile Range (IQR) | 6.1% | 4.8% |
| Standard Deviation (Sample) | 11.2% | 6.0% |
| Standard Deviation (Population) | 11.1% | 5.9% |
Similar Demographics by Unemployment Among Women with Children Under 6 years
Demographics Similar to Peruvians by Unemployment Among Women with Children Under 6 years
In terms of unemployment among women with children under 6 years, the demographic groups most similar to Peruvians are Croatian (7.5%, a difference of 0.030%), Immigrants from Southern Europe (7.5%, a difference of 0.080%), Immigrants from Philippines (7.5%, a difference of 0.080%), Bolivian (7.5%, a difference of 0.12%), and South American (7.5%, a difference of 0.16%).
| Demographics | Rating | Rank | Unemployment Among Women with Children Under 6 years |
| Aleuts | 76.0 /100 | #150 | Good 7.5% |
| Immigrants | Peru | 74.9 /100 | #151 | Good 7.5% |
| Bangladeshis | 74.8 /100 | #152 | Good 7.5% |
| Uruguayans | 74.7 /100 | #153 | Good 7.5% |
| Northern Europeans | 74.3 /100 | #154 | Good 7.5% |
| South Americans | 74.1 /100 | #155 | Good 7.5% |
| Immigrants | Southern Europe | 73.2 /100 | #156 | Good 7.5% |
| Peruvians | 72.3 /100 | #157 | Good 7.5% |
| Croatians | 71.9 /100 | #158 | Good 7.5% |
| Immigrants | Philippines | 71.3 /100 | #159 | Good 7.5% |
| Bolivians | 70.8 /100 | #160 | Good 7.5% |
| Immigrants | Western Asia | 70.2 /100 | #161 | Good 7.5% |
| Immigrants | Lithuania | 68.8 /100 | #162 | Good 7.5% |
| British | 66.3 /100 | #163 | Good 7.6% |
| Ugandans | 65.8 /100 | #164 | Good 7.6% |
Demographics Similar to Pakistanis by Unemployment Among Women with Children Under 6 years
In terms of unemployment among women with children under 6 years, the demographic groups most similar to Pakistanis are Immigrants from Burma/Myanmar (7.3%, a difference of 0.070%), Immigrants from South Africa (7.3%, a difference of 0.080%), Jordanian (7.3%, a difference of 0.16%), Zimbabwean (7.3%, a difference of 0.17%), and Immigrants from Zaire (7.3%, a difference of 0.28%).
| Demographics | Rating | Rank | Unemployment Among Women with Children Under 6 years |
| Serbians | 94.5 /100 | #118 | Exceptional 7.3% |
| South Africans | 94.1 /100 | #119 | Exceptional 7.3% |
| Iraqis | 93.9 /100 | #120 | Exceptional 7.3% |
| Immigrants | Chile | 93.5 /100 | #121 | Exceptional 7.3% |
| Immigrants | Bosnia and Herzegovina | 93.5 /100 | #122 | Exceptional 7.3% |
| Immigrants | Zaire | 93.3 /100 | #123 | Exceptional 7.3% |
| Immigrants | South Africa | 92.5 /100 | #124 | Exceptional 7.3% |
| Pakistanis | 92.2 /100 | #125 | Exceptional 7.3% |
| Immigrants | Burma/Myanmar | 91.9 /100 | #126 | Exceptional 7.3% |
| Jordanians | 91.5 /100 | #127 | Exceptional 7.3% |
| Zimbabweans | 91.5 /100 | #128 | Exceptional 7.3% |
| Slovenes | 89.2 /100 | #129 | Excellent 7.4% |
| Swedes | 88.4 /100 | #130 | Excellent 7.4% |
| Ukrainians | 88.2 /100 | #131 | Excellent 7.4% |
| Immigrants | Armenia | 87.4 /100 | #132 | Excellent 7.4% |