Immigrants from Honduras vs Immigrants from Jordan Unemployment Among Women with Children Under 6 years
COMPARE
Immigrants from Honduras
Immigrants from Jordan
Unemployment Among Women with Children Under 6 years
Unemployment Among Women with Children Under 6 years Comparison
Immigrants from Honduras
Immigrants from Jordan
8.4%
UNEMPLOYMENT AMONG WOMEN WITH CHILDREN UNDER 6 YEARS
0.3/ 100
METRIC RATING
266th/ 347
METRIC RANK
7.5%
UNEMPLOYMENT AMONG WOMEN WITH CHILDREN UNDER 6 YEARS
78.9/ 100
METRIC RATING
145th/ 347
METRIC RANK
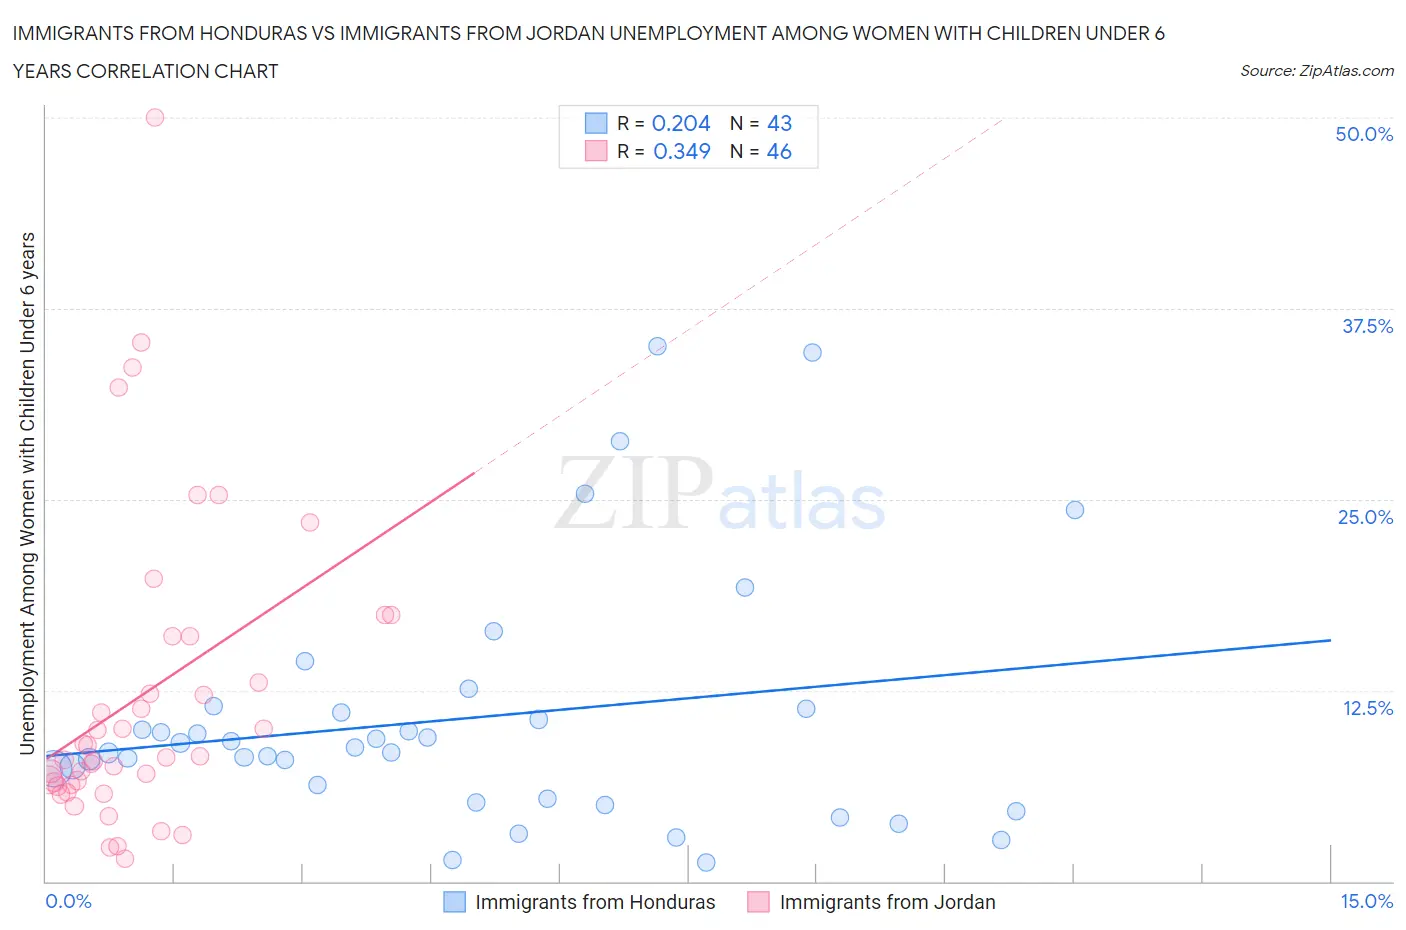
Immigrants from Honduras vs Immigrants from Jordan Unemployment Among Women with Children Under 6 years Correlation Chart
The statistical analysis conducted on geographies consisting of 261,485,985 people shows a weak positive correlation between the proportion of Immigrants from Honduras and unemployment rate among women with children under the age of 6 in the United States with a correlation coefficient (R) of 0.204 and weighted average of 8.4%. Similarly, the statistical analysis conducted on geographies consisting of 157,070,333 people shows a mild positive correlation between the proportion of Immigrants from Jordan and unemployment rate among women with children under the age of 6 in the United States with a correlation coefficient (R) of 0.349 and weighted average of 7.5%, a difference of 12.3%.
Unemployment Among Women with Children Under 6 years Correlation Summary
| Measurement | Immigrants from Honduras | Immigrants from Jordan |
| Minimum | 1.2% | 1.5% |
| Maximum | 35.0% | 50.0% |
| Range | 33.8% | 48.5% |
| Mean | 10.6% | 12.2% |
| Median | 8.8% | 8.2% |
| Interquartile 25% (IQ1) | 5.4% | 6.3% |
| Interquartile 75% (IQ3) | 11.3% | 16.0% |
| Interquartile Range (IQR) | 5.9% | 9.7% |
| Standard Deviation (Sample) | 8.0% | 10.1% |
| Standard Deviation (Population) | 7.9% | 9.9% |
Similar Demographics by Unemployment Among Women with Children Under 6 years
Demographics Similar to Immigrants from Honduras by Unemployment Among Women with Children Under 6 years
In terms of unemployment among women with children under 6 years, the demographic groups most similar to Immigrants from Honduras are French Canadian (8.4%, a difference of 0.0%), Honduran (8.4%, a difference of 0.050%), Scotch-Irish (8.4%, a difference of 0.070%), West Indian (8.4%, a difference of 0.11%), and Immigrants from Liberia (8.4%, a difference of 0.12%).
| Demographics | Rating | Rank | Unemployment Among Women with Children Under 6 years |
| Barbadians | 0.4 /100 | #259 | Tragic 8.3% |
| Whites/Caucasians | 0.3 /100 | #260 | Tragic 8.4% |
| Immigrants | Liberia | 0.3 /100 | #261 | Tragic 8.4% |
| West Indians | 0.3 /100 | #262 | Tragic 8.4% |
| Scotch-Irish | 0.3 /100 | #263 | Tragic 8.4% |
| Hondurans | 0.3 /100 | #264 | Tragic 8.4% |
| French Canadians | 0.3 /100 | #265 | Tragic 8.4% |
| Immigrants | Honduras | 0.3 /100 | #266 | Tragic 8.4% |
| Belizeans | 0.2 /100 | #267 | Tragic 8.4% |
| Sub-Saharan Africans | 0.2 /100 | #268 | Tragic 8.4% |
| Immigrants | Haiti | 0.2 /100 | #269 | Tragic 8.4% |
| Immigrants | Senegal | 0.2 /100 | #270 | Tragic 8.5% |
| Immigrants | Congo | 0.2 /100 | #271 | Tragic 8.5% |
| Mexican American Indians | 0.1 /100 | #272 | Tragic 8.5% |
| Slovaks | 0.1 /100 | #273 | Tragic 8.5% |
Demographics Similar to Immigrants from Jordan by Unemployment Among Women with Children Under 6 years
In terms of unemployment among women with children under 6 years, the demographic groups most similar to Immigrants from Jordan are Japanese (7.5%, a difference of 0.0%), European (7.5%, a difference of 0.030%), Immigrants from Oceania (7.5%, a difference of 0.050%), Immigrants from Brazil (7.5%, a difference of 0.16%), and Korean (7.5%, a difference of 0.26%).
| Demographics | Rating | Rank | Unemployment Among Women with Children Under 6 years |
| Immigrants | Norway | 84.1 /100 | #138 | Excellent 7.4% |
| Immigrants | Colombia | 83.9 /100 | #139 | Excellent 7.4% |
| Scandinavians | 83.0 /100 | #140 | Excellent 7.4% |
| Greeks | 82.6 /100 | #141 | Excellent 7.4% |
| Immigrants | Argentina | 81.5 /100 | #142 | Excellent 7.5% |
| Koreans | 81.3 /100 | #143 | Excellent 7.5% |
| Europeans | 79.1 /100 | #144 | Good 7.5% |
| Immigrants | Jordan | 78.9 /100 | #145 | Good 7.5% |
| Japanese | 78.9 /100 | #146 | Good 7.5% |
| Immigrants | Oceania | 78.4 /100 | #147 | Good 7.5% |
| Immigrants | Brazil | 77.3 /100 | #148 | Good 7.5% |
| Colombians | 76.1 /100 | #149 | Good 7.5% |
| Aleuts | 76.0 /100 | #150 | Good 7.5% |
| Immigrants | Peru | 74.9 /100 | #151 | Good 7.5% |
| Bangladeshis | 74.8 /100 | #152 | Good 7.5% |