Peruvian vs Immigrants from Cameroon Unemployment Among Women with Children Under 6 years
COMPARE
Peruvian
Immigrants from Cameroon
Unemployment Among Women with Children Under 6 years
Unemployment Among Women with Children Under 6 years Comparison
Peruvians
Immigrants from Cameroon
7.5%
UNEMPLOYMENT AMONG WOMEN WITH CHILDREN UNDER 6 YEARS
72.3/ 100
METRIC RATING
157th/ 347
METRIC RANK
8.6%
UNEMPLOYMENT AMONG WOMEN WITH CHILDREN UNDER 6 YEARS
0.1/ 100
METRIC RATING
274th/ 347
METRIC RANK
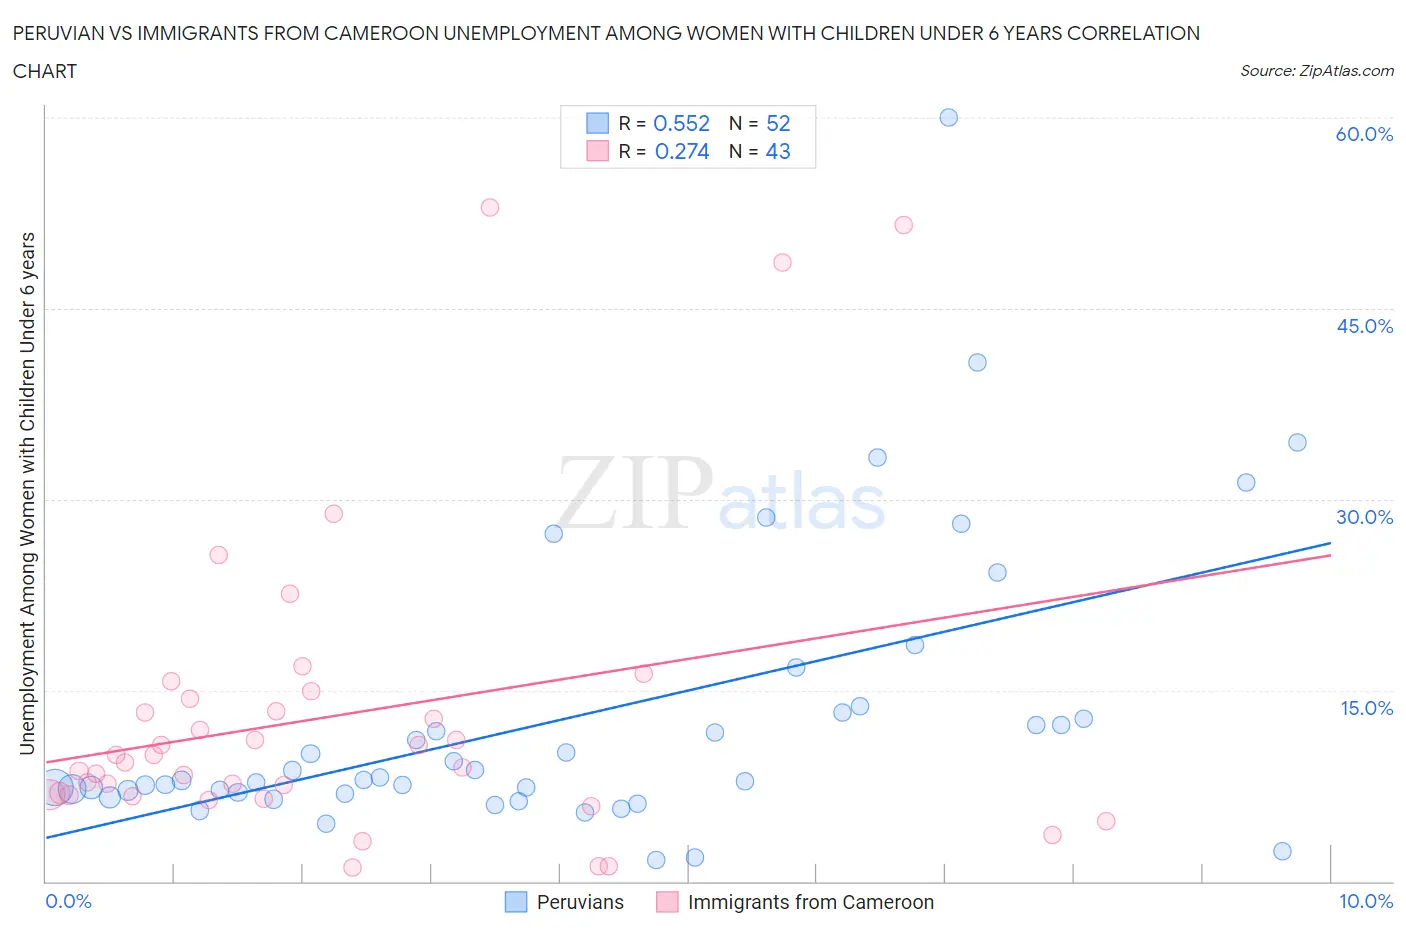
Peruvian vs Immigrants from Cameroon Unemployment Among Women with Children Under 6 years Correlation Chart
The statistical analysis conducted on geographies consisting of 286,643,171 people shows a substantial positive correlation between the proportion of Peruvians and unemployment rate among women with children under the age of 6 in the United States with a correlation coefficient (R) of 0.552 and weighted average of 7.5%. Similarly, the statistical analysis conducted on geographies consisting of 118,311,400 people shows a weak positive correlation between the proportion of Immigrants from Cameroon and unemployment rate among women with children under the age of 6 in the United States with a correlation coefficient (R) of 0.274 and weighted average of 8.6%, a difference of 14.0%.
Unemployment Among Women with Children Under 6 years Correlation Summary
| Measurement | Peruvian | Immigrants from Cameroon |
| Minimum | 1.7% | 1.1% |
| Maximum | 60.0% | 52.9% |
| Range | 58.3% | 51.8% |
| Mean | 12.8% | 13.0% |
| Median | 7.9% | 9.3% |
| Interquartile 25% (IQ1) | 6.9% | 6.8% |
| Interquartile 75% (IQ3) | 13.1% | 14.4% |
| Interquartile Range (IQR) | 6.1% | 7.6% |
| Standard Deviation (Sample) | 11.2% | 12.1% |
| Standard Deviation (Population) | 11.1% | 11.9% |
Similar Demographics by Unemployment Among Women with Children Under 6 years
Demographics Similar to Peruvians by Unemployment Among Women with Children Under 6 years
In terms of unemployment among women with children under 6 years, the demographic groups most similar to Peruvians are Croatian (7.5%, a difference of 0.030%), Immigrants from Southern Europe (7.5%, a difference of 0.080%), Immigrants from Philippines (7.5%, a difference of 0.080%), Bolivian (7.5%, a difference of 0.12%), and South American (7.5%, a difference of 0.16%).
| Demographics | Rating | Rank | Unemployment Among Women with Children Under 6 years |
| Aleuts | 76.0 /100 | #150 | Good 7.5% |
| Immigrants | Peru | 74.9 /100 | #151 | Good 7.5% |
| Bangladeshis | 74.8 /100 | #152 | Good 7.5% |
| Uruguayans | 74.7 /100 | #153 | Good 7.5% |
| Northern Europeans | 74.3 /100 | #154 | Good 7.5% |
| South Americans | 74.1 /100 | #155 | Good 7.5% |
| Immigrants | Southern Europe | 73.2 /100 | #156 | Good 7.5% |
| Peruvians | 72.3 /100 | #157 | Good 7.5% |
| Croatians | 71.9 /100 | #158 | Good 7.5% |
| Immigrants | Philippines | 71.3 /100 | #159 | Good 7.5% |
| Bolivians | 70.8 /100 | #160 | Good 7.5% |
| Immigrants | Western Asia | 70.2 /100 | #161 | Good 7.5% |
| Immigrants | Lithuania | 68.8 /100 | #162 | Good 7.5% |
| British | 66.3 /100 | #163 | Good 7.6% |
| Ugandans | 65.8 /100 | #164 | Good 7.6% |
Demographics Similar to Immigrants from Cameroon by Unemployment Among Women with Children Under 6 years
In terms of unemployment among women with children under 6 years, the demographic groups most similar to Immigrants from Cameroon are Immigrants from Latin America (8.6%, a difference of 0.050%), Yaqui (8.6%, a difference of 0.40%), Haitian (8.6%, a difference of 0.50%), Slovak (8.5%, a difference of 0.67%), and Mexican American Indian (8.5%, a difference of 0.75%).
| Demographics | Rating | Rank | Unemployment Among Women with Children Under 6 years |
| Belizeans | 0.2 /100 | #267 | Tragic 8.4% |
| Sub-Saharan Africans | 0.2 /100 | #268 | Tragic 8.4% |
| Immigrants | Haiti | 0.2 /100 | #269 | Tragic 8.4% |
| Immigrants | Senegal | 0.2 /100 | #270 | Tragic 8.5% |
| Immigrants | Congo | 0.2 /100 | #271 | Tragic 8.5% |
| Mexican American Indians | 0.1 /100 | #272 | Tragic 8.5% |
| Slovaks | 0.1 /100 | #273 | Tragic 8.5% |
| Immigrants | Cameroon | 0.1 /100 | #274 | Tragic 8.6% |
| Immigrants | Latin America | 0.1 /100 | #275 | Tragic 8.6% |
| Yaqui | 0.0 /100 | #276 | Tragic 8.6% |
| Haitians | 0.0 /100 | #277 | Tragic 8.6% |
| Immigrants | Dominica | 0.0 /100 | #278 | Tragic 8.6% |
| Immigrants | Guatemala | 0.0 /100 | #279 | Tragic 8.6% |
| Immigrants | Belize | 0.0 /100 | #280 | Tragic 8.6% |
| Guatemalans | 0.0 /100 | #281 | Tragic 8.7% |