Pakistani vs Immigrants from Asia Female Unemployment
COMPARE
Pakistani
Immigrants from Asia
Female Unemployment
Female Unemployment Comparison
Pakistanis
Immigrants from Asia
5.1%
FEMALE UNEMPLOYMENT
83.8/ 100
METRIC RATING
137th/ 347
METRIC RANK
5.2%
FEMALE UNEMPLOYMENT
64.3/ 100
METRIC RATING
163rd/ 347
METRIC RANK
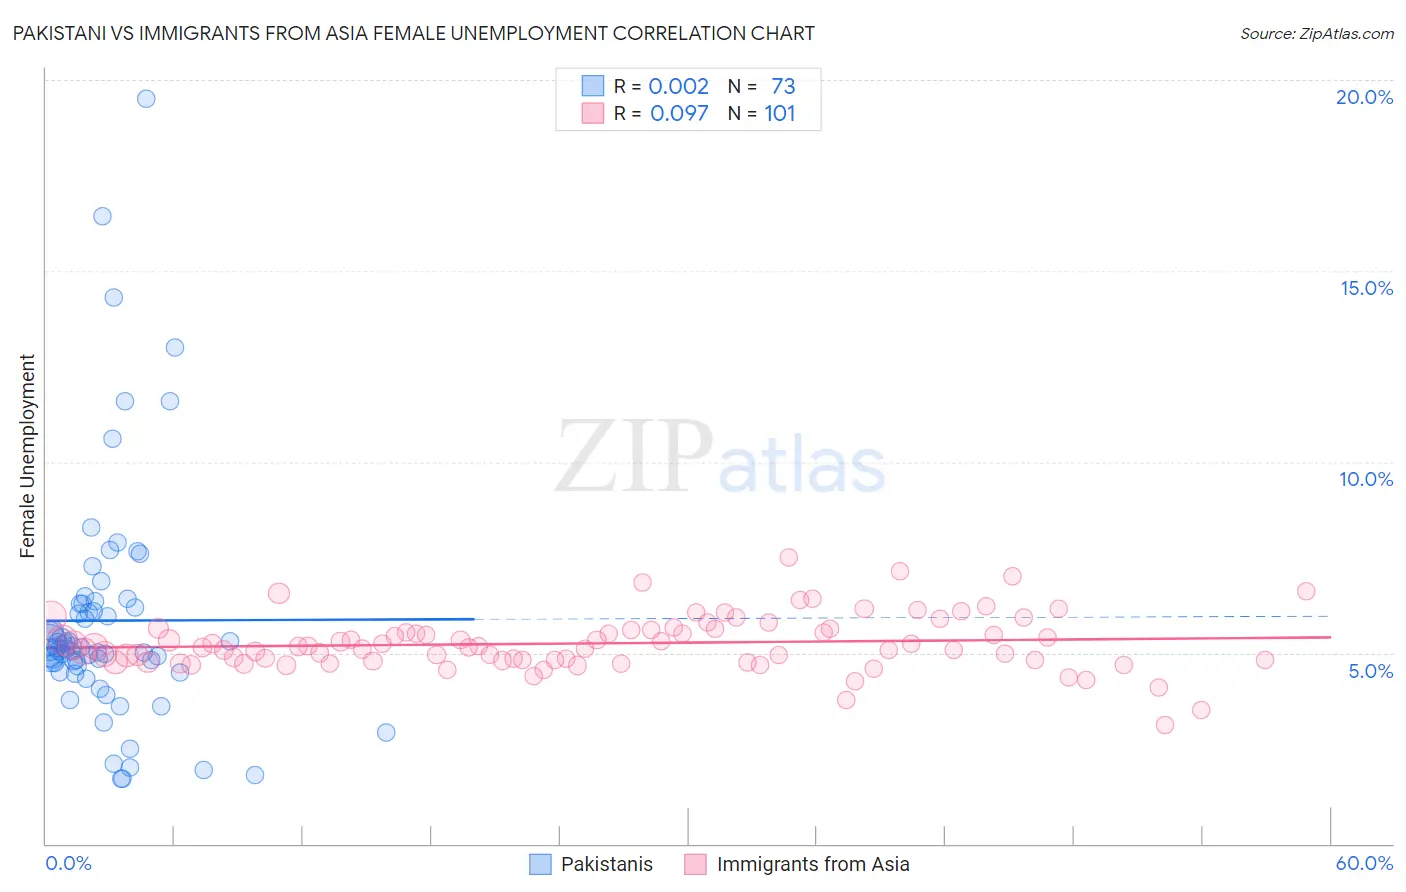
Pakistani vs Immigrants from Asia Female Unemployment Correlation Chart
The statistical analysis conducted on geographies consisting of 334,292,014 people shows no correlation between the proportion of Pakistanis and unemploymnet rate among females in the United States with a correlation coefficient (R) of 0.002 and weighted average of 5.1%. Similarly, the statistical analysis conducted on geographies consisting of 540,737,875 people shows a slight positive correlation between the proportion of Immigrants from Asia and unemploymnet rate among females in the United States with a correlation coefficient (R) of 0.097 and weighted average of 5.2%, a difference of 1.6%.
Female Unemployment Correlation Summary
| Measurement | Pakistani | Immigrants from Asia |
| Minimum | 1.7% | 3.1% |
| Maximum | 19.5% | 7.5% |
| Range | 17.8% | 4.4% |
| Mean | 5.8% | 5.2% |
| Median | 5.1% | 5.2% |
| Interquartile 25% (IQ1) | 4.6% | 4.8% |
| Interquartile 75% (IQ3) | 6.3% | 5.6% |
| Interquartile Range (IQR) | 1.7% | 0.82% |
| Standard Deviation (Sample) | 3.1% | 0.72% |
| Standard Deviation (Population) | 3.1% | 0.72% |
Similar Demographics by Female Unemployment
Demographics Similar to Pakistanis by Female Unemployment
In terms of female unemployment, the demographic groups most similar to Pakistanis are Indian (Asian) (5.1%, a difference of 0.040%), Chickasaw (5.1%, a difference of 0.060%), Immigrants from Eastern Asia (5.1%, a difference of 0.080%), Immigrants from Eritrea (5.1%, a difference of 0.090%), and Immigrants from Latvia (5.1%, a difference of 0.090%).
| Demographics | Rating | Rank | Female Unemployment |
| Maltese | 85.5 /100 | #130 | Excellent 5.1% |
| Immigrants | Ethiopia | 85.4 /100 | #131 | Excellent 5.1% |
| Immigrants | Sri Lanka | 85.0 /100 | #132 | Excellent 5.1% |
| Immigrants | Hong Kong | 84.8 /100 | #133 | Excellent 5.1% |
| Immigrants | Eritrea | 84.6 /100 | #134 | Excellent 5.1% |
| Immigrants | Latvia | 84.6 /100 | #135 | Excellent 5.1% |
| Indians (Asian) | 84.2 /100 | #136 | Excellent 5.1% |
| Pakistanis | 83.8 /100 | #137 | Excellent 5.1% |
| Chickasaw | 83.2 /100 | #138 | Excellent 5.1% |
| Immigrants | Eastern Asia | 83.0 /100 | #139 | Excellent 5.1% |
| Immigrants | France | 82.7 /100 | #140 | Excellent 5.1% |
| Immigrants | Eastern Europe | 81.5 /100 | #141 | Excellent 5.1% |
| Palestinians | 80.8 /100 | #142 | Excellent 5.1% |
| Immigrants | Kazakhstan | 80.7 /100 | #143 | Excellent 5.1% |
| Immigrants | Jordan | 80.4 /100 | #144 | Excellent 5.1% |
Demographics Similar to Immigrants from Asia by Female Unemployment
In terms of female unemployment, the demographic groups most similar to Immigrants from Asia are Bangladeshi (5.2%, a difference of 0.0%), Syrian (5.2%, a difference of 0.10%), Native Hawaiian (5.2%, a difference of 0.10%), Potawatomi (5.2%, a difference of 0.11%), and Immigrants from Thailand (5.2%, a difference of 0.14%).
| Demographics | Rating | Rank | Female Unemployment |
| Immigrants | Northern Africa | 69.6 /100 | #156 | Good 5.2% |
| Immigrants | Russia | 69.3 /100 | #157 | Good 5.2% |
| Albanians | 68.3 /100 | #158 | Good 5.2% |
| Immigrants | Micronesia | 66.9 /100 | #159 | Good 5.2% |
| Immigrants | Spain | 66.8 /100 | #160 | Good 5.2% |
| Immigrants | Pakistan | 66.7 /100 | #161 | Good 5.2% |
| Potawatomi | 65.9 /100 | #162 | Good 5.2% |
| Immigrants | Asia | 64.3 /100 | #163 | Good 5.2% |
| Bangladeshis | 64.3 /100 | #164 | Good 5.2% |
| Syrians | 62.8 /100 | #165 | Good 5.2% |
| Native Hawaiians | 62.7 /100 | #166 | Good 5.2% |
| Immigrants | Thailand | 62.1 /100 | #167 | Good 5.2% |
| Sri Lankans | 59.4 /100 | #168 | Average 5.2% |
| Immigrants | Chile | 59.0 /100 | #169 | Average 5.2% |
| Spanish | 55.9 /100 | #170 | Average 5.2% |