Pakistani vs Celtic Female Unemployment
COMPARE
Pakistani
Celtic
Female Unemployment
Female Unemployment Comparison
Pakistanis
Celtics
5.1%
FEMALE UNEMPLOYMENT
83.8/ 100
METRIC RATING
137th/ 347
METRIC RANK
4.9%
FEMALE UNEMPLOYMENT
98.5/ 100
METRIC RATING
64th/ 347
METRIC RANK
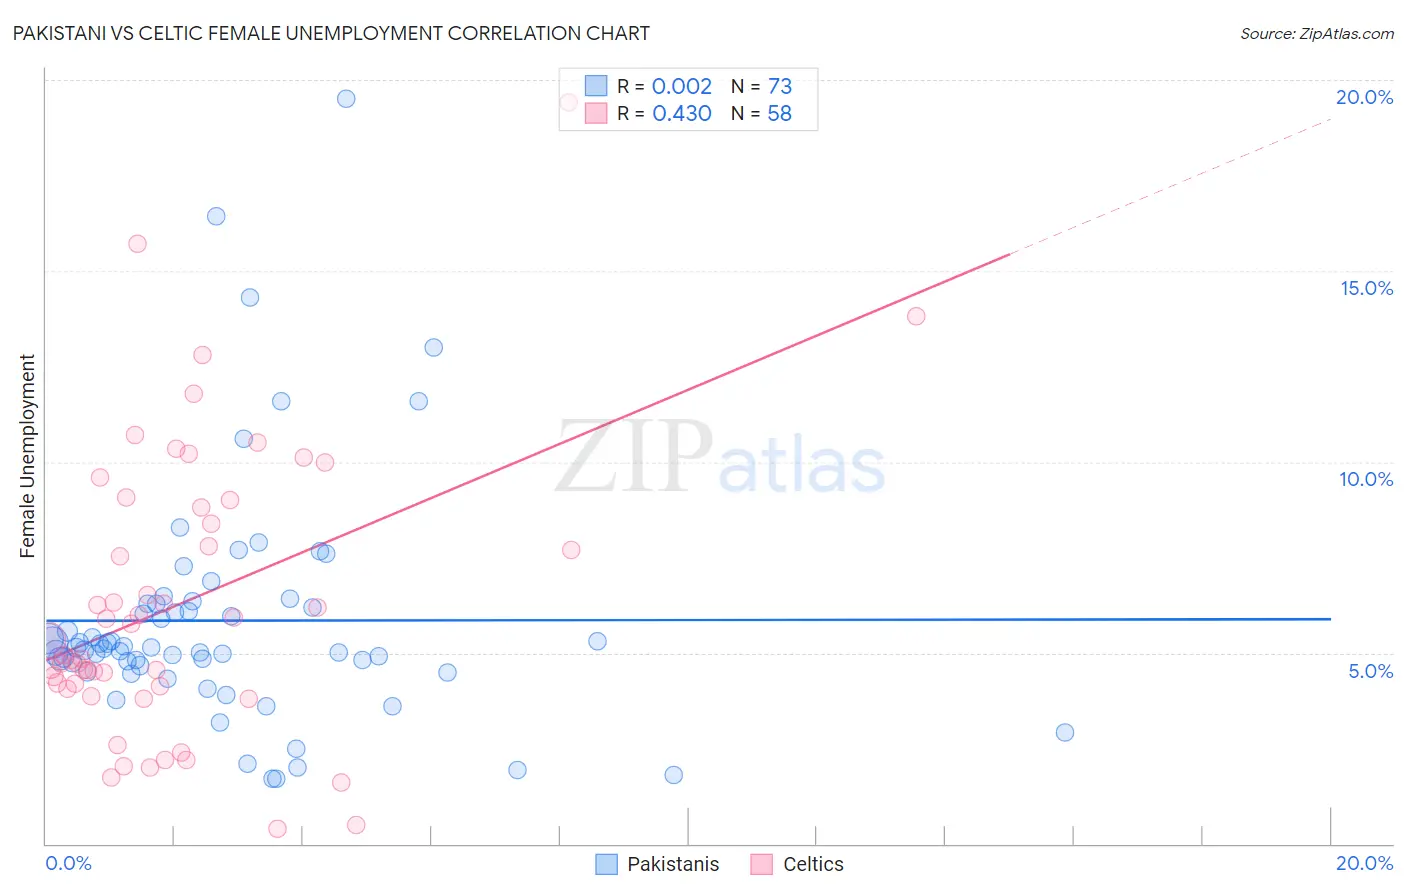
Pakistani vs Celtic Female Unemployment Correlation Chart
The statistical analysis conducted on geographies consisting of 334,292,014 people shows no correlation between the proportion of Pakistanis and unemploymnet rate among females in the United States with a correlation coefficient (R) of 0.002 and weighted average of 5.1%. Similarly, the statistical analysis conducted on geographies consisting of 168,426,082 people shows a moderate positive correlation between the proportion of Celtics and unemploymnet rate among females in the United States with a correlation coefficient (R) of 0.430 and weighted average of 4.9%, a difference of 4.1%.
Female Unemployment Correlation Summary
| Measurement | Pakistani | Celtic |
| Minimum | 1.7% | 0.40% |
| Maximum | 19.5% | 19.4% |
| Range | 17.8% | 19.0% |
| Mean | 5.8% | 6.3% |
| Median | 5.1% | 5.1% |
| Interquartile 25% (IQ1) | 4.6% | 4.1% |
| Interquartile 75% (IQ3) | 6.3% | 8.8% |
| Interquartile Range (IQR) | 1.7% | 4.7% |
| Standard Deviation (Sample) | 3.1% | 3.8% |
| Standard Deviation (Population) | 3.1% | 3.7% |
Similar Demographics by Female Unemployment
Demographics Similar to Pakistanis by Female Unemployment
In terms of female unemployment, the demographic groups most similar to Pakistanis are Indian (Asian) (5.1%, a difference of 0.040%), Chickasaw (5.1%, a difference of 0.060%), Immigrants from Eastern Asia (5.1%, a difference of 0.080%), Immigrants from Eritrea (5.1%, a difference of 0.090%), and Immigrants from Latvia (5.1%, a difference of 0.090%).
| Demographics | Rating | Rank | Female Unemployment |
| Maltese | 85.5 /100 | #130 | Excellent 5.1% |
| Immigrants | Ethiopia | 85.4 /100 | #131 | Excellent 5.1% |
| Immigrants | Sri Lanka | 85.0 /100 | #132 | Excellent 5.1% |
| Immigrants | Hong Kong | 84.8 /100 | #133 | Excellent 5.1% |
| Immigrants | Eritrea | 84.6 /100 | #134 | Excellent 5.1% |
| Immigrants | Latvia | 84.6 /100 | #135 | Excellent 5.1% |
| Indians (Asian) | 84.2 /100 | #136 | Excellent 5.1% |
| Pakistanis | 83.8 /100 | #137 | Excellent 5.1% |
| Chickasaw | 83.2 /100 | #138 | Excellent 5.1% |
| Immigrants | Eastern Asia | 83.0 /100 | #139 | Excellent 5.1% |
| Immigrants | France | 82.7 /100 | #140 | Excellent 5.1% |
| Immigrants | Eastern Europe | 81.5 /100 | #141 | Excellent 5.1% |
| Palestinians | 80.8 /100 | #142 | Excellent 5.1% |
| Immigrants | Kazakhstan | 80.7 /100 | #143 | Excellent 5.1% |
| Immigrants | Jordan | 80.4 /100 | #144 | Excellent 5.1% |
Demographics Similar to Celtics by Female Unemployment
In terms of female unemployment, the demographic groups most similar to Celtics are Immigrants from Belgium (4.9%, a difference of 0.0%), Immigrants from Canada (4.9%, a difference of 0.12%), Immigrants from Nepal (4.9%, a difference of 0.12%), Immigrants from Scotland (4.9%, a difference of 0.13%), and Immigrants from North America (4.9%, a difference of 0.19%).
| Demographics | Rating | Rank | Female Unemployment |
| Icelanders | 98.8 /100 | #57 | Exceptional 4.9% |
| Immigrants | Lithuania | 98.8 /100 | #58 | Exceptional 4.9% |
| Bhutanese | 98.7 /100 | #59 | Exceptional 4.9% |
| Immigrants | Scotland | 98.6 /100 | #60 | Exceptional 4.9% |
| Immigrants | Canada | 98.6 /100 | #61 | Exceptional 4.9% |
| Immigrants | Nepal | 98.6 /100 | #62 | Exceptional 4.9% |
| Immigrants | Belgium | 98.5 /100 | #63 | Exceptional 4.9% |
| Celtics | 98.5 /100 | #64 | Exceptional 4.9% |
| Immigrants | North America | 98.3 /100 | #65 | Exceptional 4.9% |
| Hungarians | 98.3 /100 | #66 | Exceptional 4.9% |
| Cubans | 98.3 /100 | #67 | Exceptional 4.9% |
| Tlingit-Haida | 98.3 /100 | #68 | Exceptional 4.9% |
| Immigrants | Ireland | 98.2 /100 | #69 | Exceptional 4.9% |
| Osage | 98.2 /100 | #70 | Exceptional 4.9% |
| German Russians | 98.1 /100 | #71 | Exceptional 4.9% |