Immigrants from El Salvador vs Lithuanian Female Unemployment
COMPARE
Immigrants from El Salvador
Lithuanian
Female Unemployment
Female Unemployment Comparison
Immigrants from El Salvador
Lithuanians
6.1%
FEMALE UNEMPLOYMENT
0.0/ 100
METRIC RATING
294th/ 347
METRIC RANK
4.7%
FEMALE UNEMPLOYMENT
99.8/ 100
METRIC RATING
30th/ 347
METRIC RANK
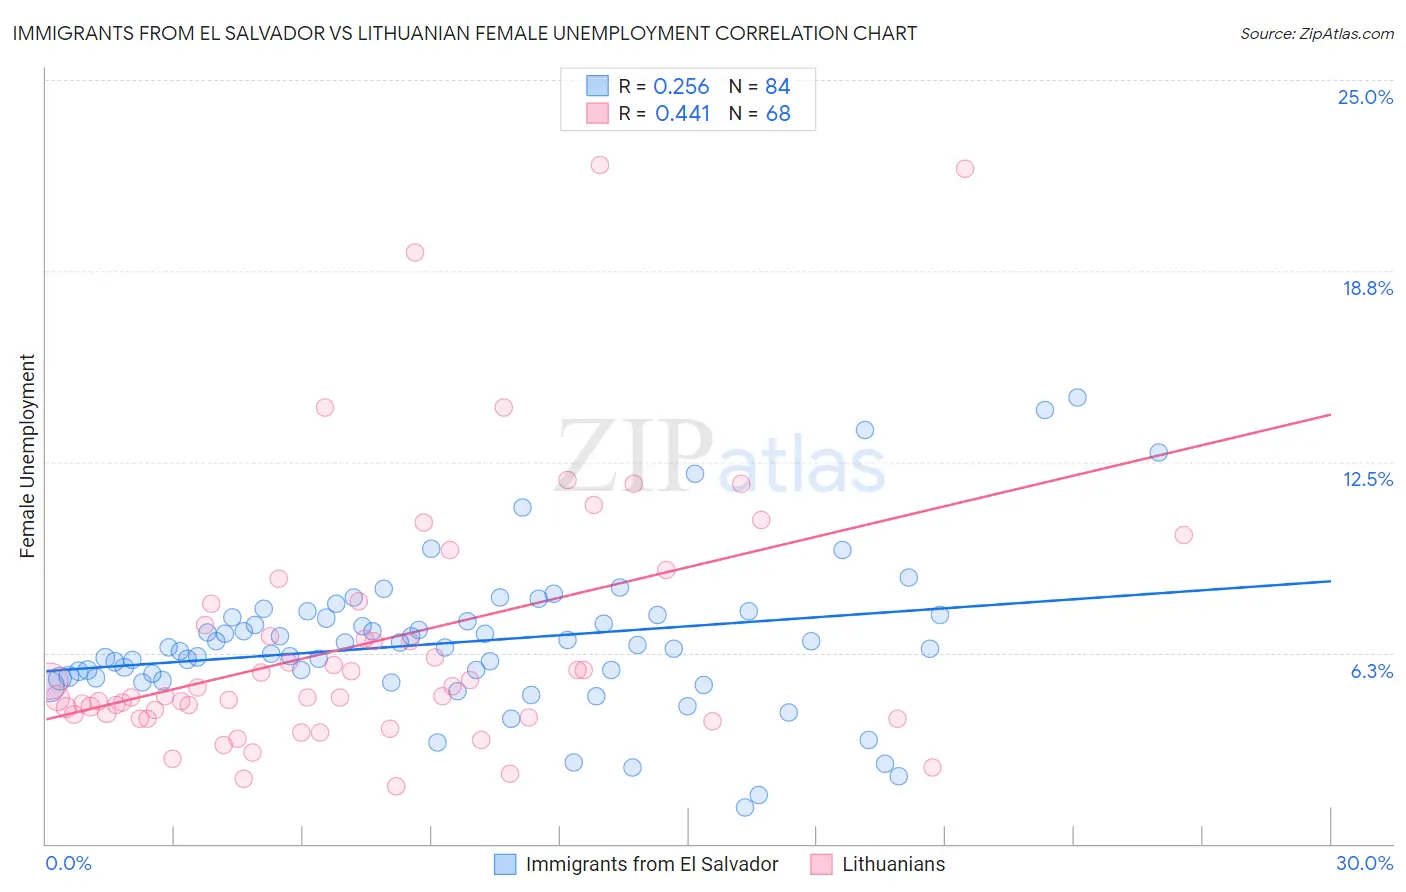
Immigrants from El Salvador vs Lithuanian Female Unemployment Correlation Chart
The statistical analysis conducted on geographies consisting of 356,565,634 people shows a weak positive correlation between the proportion of Immigrants from El Salvador and unemploymnet rate among females in the United States with a correlation coefficient (R) of 0.256 and weighted average of 6.1%. Similarly, the statistical analysis conducted on geographies consisting of 418,507,146 people shows a moderate positive correlation between the proportion of Lithuanians and unemploymnet rate among females in the United States with a correlation coefficient (R) of 0.441 and weighted average of 4.7%, a difference of 28.9%.
Female Unemployment Correlation Summary
| Measurement | Immigrants from El Salvador | Lithuanian |
| Minimum | 1.2% | 1.9% |
| Maximum | 14.6% | 22.2% |
| Range | 13.4% | 20.3% |
| Mean | 6.6% | 6.6% |
| Median | 6.4% | 4.8% |
| Interquartile 25% (IQ1) | 5.5% | 4.2% |
| Interquartile 75% (IQ3) | 7.5% | 7.5% |
| Interquartile Range (IQR) | 2.0% | 3.3% |
| Standard Deviation (Sample) | 2.4% | 4.3% |
| Standard Deviation (Population) | 2.4% | 4.2% |
Similar Demographics by Female Unemployment
Demographics Similar to Immigrants from El Salvador by Female Unemployment
In terms of female unemployment, the demographic groups most similar to Immigrants from El Salvador are Mexican (6.1%, a difference of 0.10%), Immigrants from Latin America (6.1%, a difference of 0.10%), Alaskan Athabascan (6.1%, a difference of 0.12%), West Indian (6.1%, a difference of 0.13%), and Jamaican (6.1%, a difference of 0.16%).
| Demographics | Rating | Rank | Female Unemployment |
| Immigrants | Guatemala | 0.0 /100 | #287 | Tragic 6.1% |
| Haitians | 0.0 /100 | #288 | Tragic 6.1% |
| Trinidadians and Tobagonians | 0.0 /100 | #289 | Tragic 6.1% |
| Immigrants | Caribbean | 0.0 /100 | #290 | Tragic 6.1% |
| Immigrants | West Indies | 0.0 /100 | #291 | Tragic 6.1% |
| Immigrants | Trinidad and Tobago | 0.0 /100 | #292 | Tragic 6.1% |
| Mexicans | 0.0 /100 | #293 | Tragic 6.1% |
| Immigrants | El Salvador | 0.0 /100 | #294 | Tragic 6.1% |
| Immigrants | Latin America | 0.0 /100 | #295 | Tragic 6.1% |
| Alaskan Athabascans | 0.0 /100 | #296 | Tragic 6.1% |
| West Indians | 0.0 /100 | #297 | Tragic 6.1% |
| Jamaicans | 0.0 /100 | #298 | Tragic 6.1% |
| Ute | 0.0 /100 | #299 | Tragic 6.1% |
| Immigrants | Haiti | 0.0 /100 | #300 | Tragic 6.1% |
| Immigrants | Barbados | 0.0 /100 | #301 | Tragic 6.2% |
Demographics Similar to Lithuanians by Female Unemployment
In terms of female unemployment, the demographic groups most similar to Lithuanians are Cypriot (4.7%, a difference of 0.12%), Irish (4.7%, a difference of 0.13%), British (4.7%, a difference of 0.16%), Sudanese (4.8%, a difference of 0.28%), and Immigrants from Bosnia and Herzegovina (4.7%, a difference of 0.33%).
| Demographics | Rating | Rank | Female Unemployment |
| Scottish | 99.9 /100 | #23 | Exceptional 4.7% |
| Welsh | 99.9 /100 | #24 | Exceptional 4.7% |
| Immigrants | India | 99.9 /100 | #25 | Exceptional 4.7% |
| Immigrants | Bosnia and Herzegovina | 99.9 /100 | #26 | Exceptional 4.7% |
| British | 99.9 /100 | #27 | Exceptional 4.7% |
| Irish | 99.9 /100 | #28 | Exceptional 4.7% |
| Cypriots | 99.9 /100 | #29 | Exceptional 4.7% |
| Lithuanians | 99.8 /100 | #30 | Exceptional 4.7% |
| Sudanese | 99.8 /100 | #31 | Exceptional 4.8% |
| Slovaks | 99.8 /100 | #32 | Exceptional 4.8% |
| Czechoslovakians | 99.7 /100 | #33 | Exceptional 4.8% |
| Zimbabweans | 99.7 /100 | #34 | Exceptional 4.8% |
| French Canadians | 99.7 /100 | #35 | Exceptional 4.8% |
| Yugoslavians | 99.7 /100 | #36 | Exceptional 4.8% |
| Pennsylvania Germans | 99.6 /100 | #37 | Exceptional 4.8% |