Ottawa vs U.S. Virgin Islander Unemployment Among Women with Children Ages 6 to 17 years
COMPARE
Ottawa
U.S. Virgin Islander
Unemployment Among Women with Children Ages 6 to 17 years
Unemployment Among Women with Children Ages 6 to 17 years Comparison
Ottawa
U.S. Virgin Islanders
10.9%
UNEMPLOYMENT AMONG WOMEN WITH CHILDREN AGES 6 TO 17 YEARS
0.0/ 100
METRIC RATING
328th/ 347
METRIC RANK
9.7%
UNEMPLOYMENT AMONG WOMEN WITH CHILDREN AGES 6 TO 17 YEARS
0.1/ 100
METRIC RATING
275th/ 347
METRIC RANK
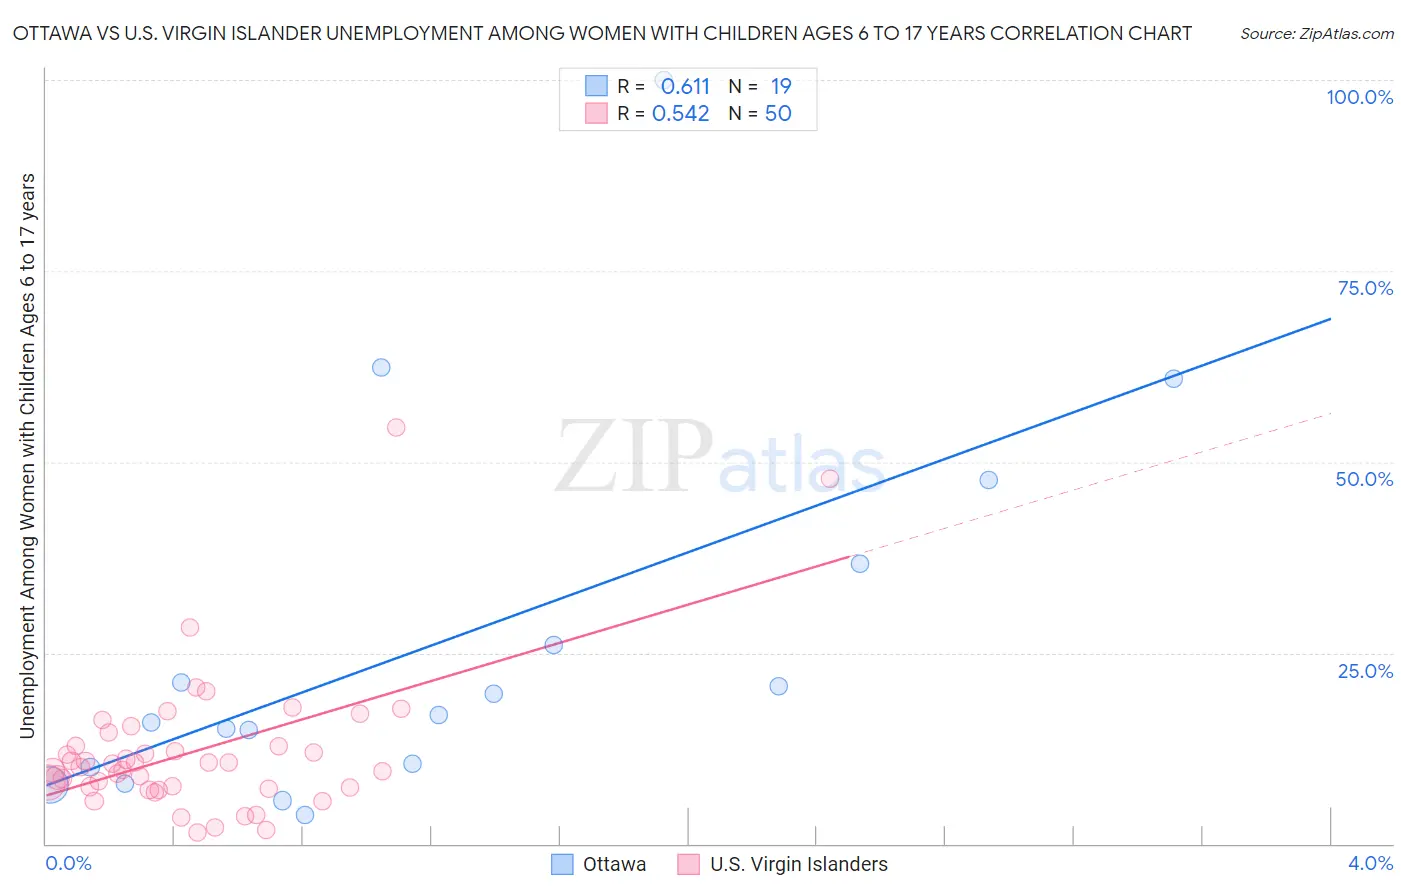
Ottawa vs U.S. Virgin Islander Unemployment Among Women with Children Ages 6 to 17 years Correlation Chart
The statistical analysis conducted on geographies consisting of 42,886,423 people shows a significant positive correlation between the proportion of Ottawa and unemployment rate among women with children between the ages 6 and 17 in the United States with a correlation coefficient (R) of 0.611 and weighted average of 10.9%. Similarly, the statistical analysis conducted on geographies consisting of 79,674,209 people shows a substantial positive correlation between the proportion of U.S. Virgin Islanders and unemployment rate among women with children between the ages 6 and 17 in the United States with a correlation coefficient (R) of 0.542 and weighted average of 9.7%, a difference of 12.3%.
Unemployment Among Women with Children Ages 6 to 17 years Correlation Summary
| Measurement | Ottawa | U.S. Virgin Islander |
| Minimum | 3.7% | 1.4% |
| Maximum | 100.0% | 54.5% |
| Range | 96.3% | 53.1% |
| Mean | 26.5% | 12.1% |
| Median | 16.8% | 10.2% |
| Interquartile 25% (IQ1) | 10.0% | 7.3% |
| Interquartile 75% (IQ3) | 36.6% | 12.8% |
| Interquartile Range (IQR) | 26.6% | 5.5% |
| Standard Deviation (Sample) | 24.9% | 9.6% |
| Standard Deviation (Population) | 24.3% | 9.5% |
Similar Demographics by Unemployment Among Women with Children Ages 6 to 17 years
Demographics Similar to Ottawa by Unemployment Among Women with Children Ages 6 to 17 years
In terms of unemployment among women with children ages 6 to 17 years, the demographic groups most similar to Ottawa are Cape Verdean (10.9%, a difference of 0.14%), Liberian (10.8%, a difference of 0.20%), Cajun (10.8%, a difference of 0.27%), Immigrants from Dominican Republic (10.8%, a difference of 0.46%), and Dominican (10.8%, a difference of 0.52%).
| Demographics | Rating | Rank | Unemployment Among Women with Children Ages 6 to 17 years |
| Tohono O'odham | 0.0 /100 | #321 | Tragic 10.7% |
| Cree | 0.0 /100 | #322 | Tragic 10.8% |
| Dominicans | 0.0 /100 | #323 | Tragic 10.8% |
| Immigrants | Dominican Republic | 0.0 /100 | #324 | Tragic 10.8% |
| Cajuns | 0.0 /100 | #325 | Tragic 10.8% |
| Liberians | 0.0 /100 | #326 | Tragic 10.8% |
| Cape Verdeans | 0.0 /100 | #327 | Tragic 10.9% |
| Ottawa | 0.0 /100 | #328 | Tragic 10.9% |
| Pennsylvania Germans | 0.0 /100 | #329 | Tragic 11.0% |
| Chippewa | 0.0 /100 | #330 | Tragic 11.1% |
| Blacks/African Americans | 0.0 /100 | #331 | Tragic 11.4% |
| Tsimshian | 0.0 /100 | #332 | Tragic 11.4% |
| Natives/Alaskans | 0.0 /100 | #333 | Tragic 11.5% |
| Ugandans | 0.0 /100 | #334 | Tragic 12.0% |
| Colville | 0.0 /100 | #335 | Tragic 12.3% |
Demographics Similar to U.S. Virgin Islanders by Unemployment Among Women with Children Ages 6 to 17 years
In terms of unemployment among women with children ages 6 to 17 years, the demographic groups most similar to U.S. Virgin Islanders are Immigrants from Portugal (9.7%, a difference of 0.010%), British West Indian (9.7%, a difference of 0.060%), French (9.7%, a difference of 0.13%), Scotch-Irish (9.7%, a difference of 0.17%), and Seminole (9.7%, a difference of 0.36%).
| Demographics | Rating | Rank | Unemployment Among Women with Children Ages 6 to 17 years |
| Ghanaians | 0.2 /100 | #268 | Tragic 9.6% |
| Blackfeet | 0.2 /100 | #269 | Tragic 9.6% |
| Immigrants | Nicaragua | 0.2 /100 | #270 | Tragic 9.6% |
| Immigrants | Latin America | 0.1 /100 | #271 | Tragic 9.6% |
| Kiowa | 0.1 /100 | #272 | Tragic 9.6% |
| Whites/Caucasians | 0.1 /100 | #273 | Tragic 9.6% |
| Aleuts | 0.1 /100 | #274 | Tragic 9.6% |
| U.S. Virgin Islanders | 0.1 /100 | #275 | Tragic 9.7% |
| Immigrants | Portugal | 0.1 /100 | #276 | Tragic 9.7% |
| British West Indians | 0.1 /100 | #277 | Tragic 9.7% |
| French | 0.1 /100 | #278 | Tragic 9.7% |
| Scotch-Irish | 0.1 /100 | #279 | Tragic 9.7% |
| Seminole | 0.1 /100 | #280 | Tragic 9.7% |
| Jamaicans | 0.0 /100 | #281 | Tragic 9.8% |
| Slovaks | 0.0 /100 | #282 | Tragic 9.8% |