Immigrants from Eastern Europe vs U.S. Virgin Islander Unemployment Among Women with Children Ages 6 to 17 years
COMPARE
Immigrants from Eastern Europe
U.S. Virgin Islander
Unemployment Among Women with Children Ages 6 to 17 years
Unemployment Among Women with Children Ages 6 to 17 years Comparison
Immigrants from Eastern Europe
U.S. Virgin Islanders
8.5%
UNEMPLOYMENT AMONG WOMEN WITH CHILDREN AGES 6 TO 17 YEARS
99.0/ 100
METRIC RATING
91st/ 347
METRIC RANK
9.7%
UNEMPLOYMENT AMONG WOMEN WITH CHILDREN AGES 6 TO 17 YEARS
0.1/ 100
METRIC RATING
275th/ 347
METRIC RANK
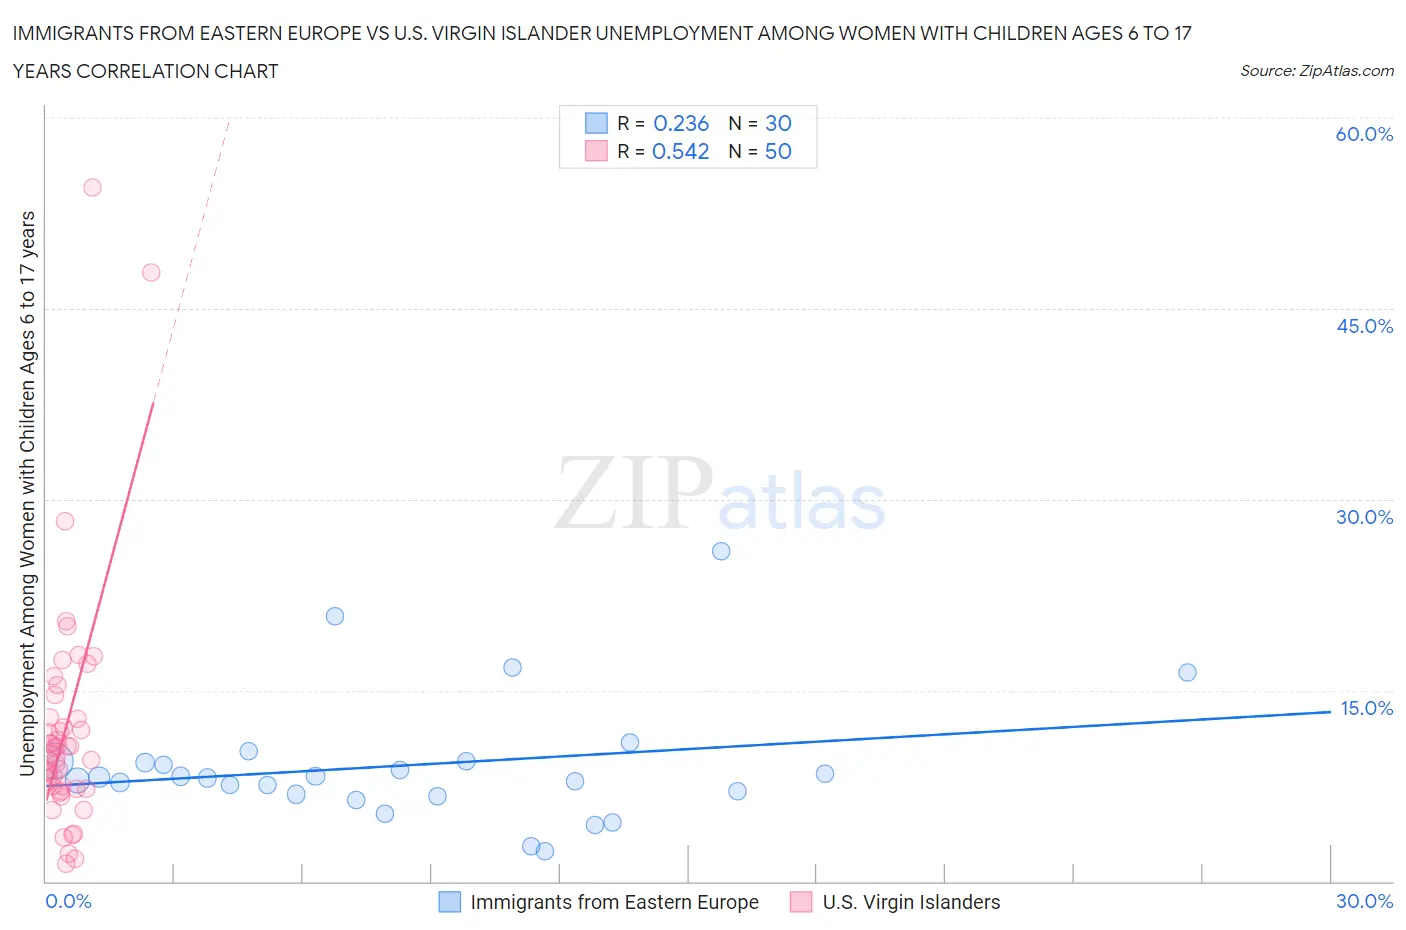
Immigrants from Eastern Europe vs U.S. Virgin Islander Unemployment Among Women with Children Ages 6 to 17 years Correlation Chart
The statistical analysis conducted on geographies consisting of 322,191,586 people shows a weak positive correlation between the proportion of Immigrants from Eastern Europe and unemployment rate among women with children between the ages 6 and 17 in the United States with a correlation coefficient (R) of 0.236 and weighted average of 8.5%. Similarly, the statistical analysis conducted on geographies consisting of 79,674,209 people shows a substantial positive correlation between the proportion of U.S. Virgin Islanders and unemployment rate among women with children between the ages 6 and 17 in the United States with a correlation coefficient (R) of 0.542 and weighted average of 9.7%, a difference of 13.8%.
Unemployment Among Women with Children Ages 6 to 17 years Correlation Summary
| Measurement | Immigrants from Eastern Europe | U.S. Virgin Islander |
| Minimum | 2.3% | 1.4% |
| Maximum | 25.9% | 54.5% |
| Range | 23.6% | 53.1% |
| Mean | 9.1% | 12.1% |
| Median | 8.2% | 10.2% |
| Interquartile 25% (IQ1) | 6.8% | 7.3% |
| Interquartile 75% (IQ3) | 9.4% | 12.8% |
| Interquartile Range (IQR) | 2.6% | 5.5% |
| Standard Deviation (Sample) | 5.0% | 9.6% |
| Standard Deviation (Population) | 4.9% | 9.5% |
Similar Demographics by Unemployment Among Women with Children Ages 6 to 17 years
Demographics Similar to Immigrants from Eastern Europe by Unemployment Among Women with Children Ages 6 to 17 years
In terms of unemployment among women with children ages 6 to 17 years, the demographic groups most similar to Immigrants from Eastern Europe are Potawatomi (8.5%, a difference of 0.030%), Yugoslavian (8.5%, a difference of 0.060%), Paiute (8.5%, a difference of 0.10%), Australian (8.5%, a difference of 0.14%), and Immigrants from Vietnam (8.5%, a difference of 0.18%).
| Demographics | Rating | Rank | Unemployment Among Women with Children Ages 6 to 17 years |
| Japanese | 99.5 /100 | #84 | Exceptional 8.4% |
| Immigrants | North Macedonia | 99.4 /100 | #85 | Exceptional 8.5% |
| Alaskan Athabascans | 99.4 /100 | #86 | Exceptional 8.5% |
| Immigrants | Israel | 99.1 /100 | #87 | Exceptional 8.5% |
| Immigrants | Vietnam | 99.1 /100 | #88 | Exceptional 8.5% |
| Paiute | 99.1 /100 | #89 | Exceptional 8.5% |
| Yugoslavians | 99.0 /100 | #90 | Exceptional 8.5% |
| Immigrants | Eastern Europe | 99.0 /100 | #91 | Exceptional 8.5% |
| Potawatomi | 99.0 /100 | #92 | Exceptional 8.5% |
| Australians | 98.9 /100 | #93 | Exceptional 8.5% |
| Immigrants | Barbados | 98.8 /100 | #94 | Exceptional 8.5% |
| Sri Lankans | 98.7 /100 | #95 | Exceptional 8.5% |
| German Russians | 98.6 /100 | #96 | Exceptional 8.5% |
| Bolivians | 98.5 /100 | #97 | Exceptional 8.5% |
| Malaysians | 98.5 /100 | #98 | Exceptional 8.6% |
Demographics Similar to U.S. Virgin Islanders by Unemployment Among Women with Children Ages 6 to 17 years
In terms of unemployment among women with children ages 6 to 17 years, the demographic groups most similar to U.S. Virgin Islanders are Immigrants from Portugal (9.7%, a difference of 0.010%), British West Indian (9.7%, a difference of 0.060%), French (9.7%, a difference of 0.13%), Scotch-Irish (9.7%, a difference of 0.17%), and Seminole (9.7%, a difference of 0.36%).
| Demographics | Rating | Rank | Unemployment Among Women with Children Ages 6 to 17 years |
| Ghanaians | 0.2 /100 | #268 | Tragic 9.6% |
| Blackfeet | 0.2 /100 | #269 | Tragic 9.6% |
| Immigrants | Nicaragua | 0.2 /100 | #270 | Tragic 9.6% |
| Immigrants | Latin America | 0.1 /100 | #271 | Tragic 9.6% |
| Kiowa | 0.1 /100 | #272 | Tragic 9.6% |
| Whites/Caucasians | 0.1 /100 | #273 | Tragic 9.6% |
| Aleuts | 0.1 /100 | #274 | Tragic 9.6% |
| U.S. Virgin Islanders | 0.1 /100 | #275 | Tragic 9.7% |
| Immigrants | Portugal | 0.1 /100 | #276 | Tragic 9.7% |
| British West Indians | 0.1 /100 | #277 | Tragic 9.7% |
| French | 0.1 /100 | #278 | Tragic 9.7% |
| Scotch-Irish | 0.1 /100 | #279 | Tragic 9.7% |
| Seminole | 0.1 /100 | #280 | Tragic 9.7% |
| Jamaicans | 0.0 /100 | #281 | Tragic 9.8% |
| Slovaks | 0.0 /100 | #282 | Tragic 9.8% |