Immigrants from Taiwan vs U.S. Virgin Islander Unemployment Among Women with Children Ages 6 to 17 years
COMPARE
Immigrants from Taiwan
U.S. Virgin Islander
Unemployment Among Women with Children Ages 6 to 17 years
Unemployment Among Women with Children Ages 6 to 17 years Comparison
Immigrants from Taiwan
U.S. Virgin Islanders
7.3%
UNEMPLOYMENT AMONG WOMEN WITH CHILDREN AGES 6 TO 17 YEARS
100.0/ 100
METRIC RATING
11th/ 347
METRIC RANK
9.7%
UNEMPLOYMENT AMONG WOMEN WITH CHILDREN AGES 6 TO 17 YEARS
0.1/ 100
METRIC RATING
275th/ 347
METRIC RANK
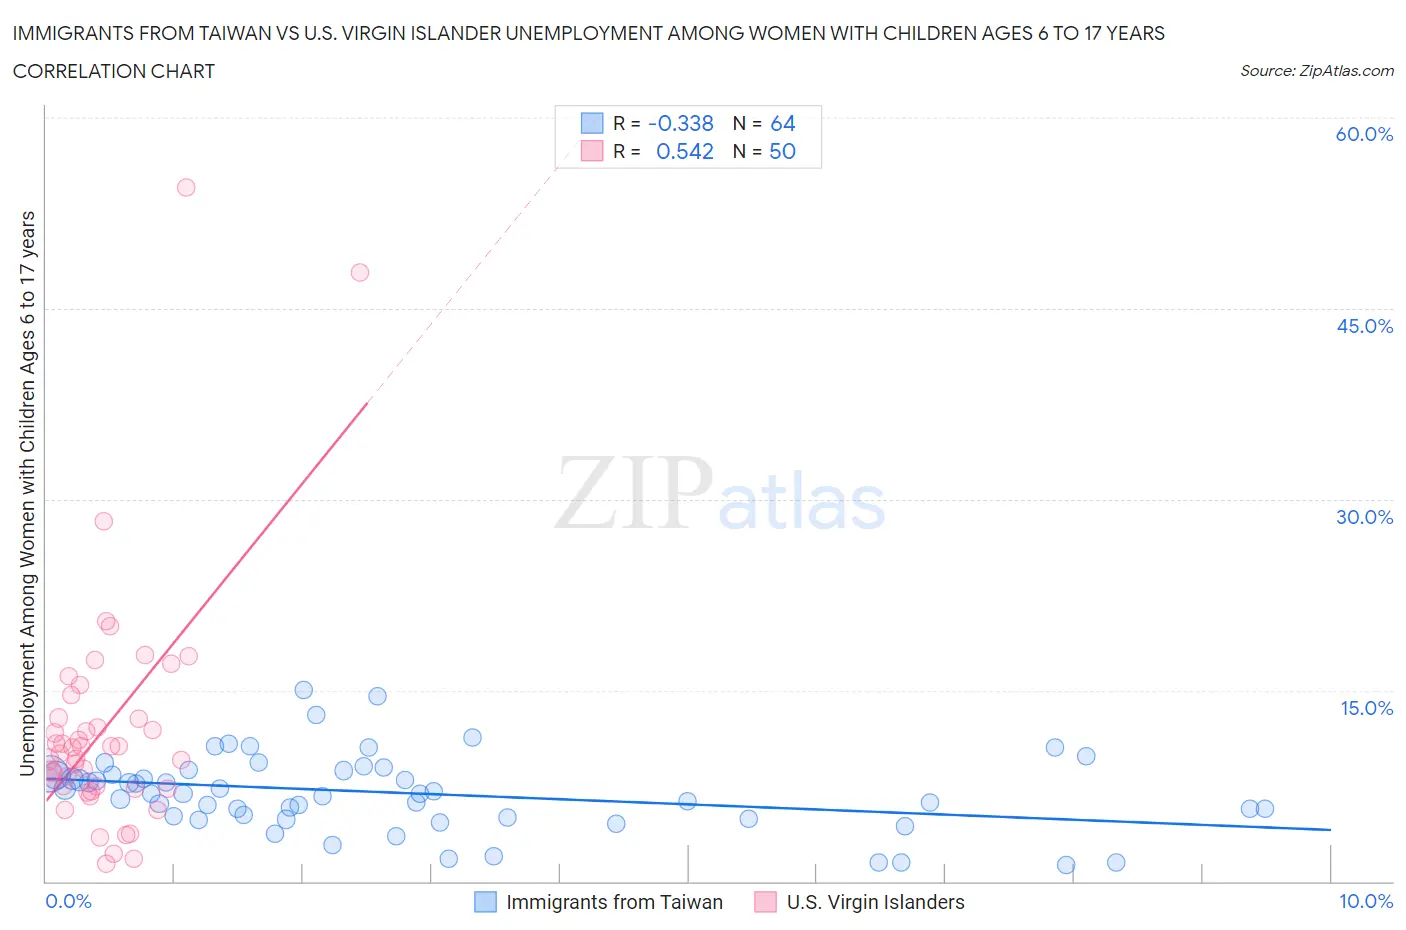
Immigrants from Taiwan vs U.S. Virgin Islander Unemployment Among Women with Children Ages 6 to 17 years Correlation Chart
The statistical analysis conducted on geographies consisting of 225,183,414 people shows a mild negative correlation between the proportion of Immigrants from Taiwan and unemployment rate among women with children between the ages 6 and 17 in the United States with a correlation coefficient (R) of -0.338 and weighted average of 7.3%. Similarly, the statistical analysis conducted on geographies consisting of 79,674,209 people shows a substantial positive correlation between the proportion of U.S. Virgin Islanders and unemployment rate among women with children between the ages 6 and 17 in the United States with a correlation coefficient (R) of 0.542 and weighted average of 9.7%, a difference of 32.1%.
Unemployment Among Women with Children Ages 6 to 17 years Correlation Summary
| Measurement | Immigrants from Taiwan | U.S. Virgin Islander |
| Minimum | 1.3% | 1.4% |
| Maximum | 15.0% | 54.5% |
| Range | 13.7% | 53.1% |
| Mean | 6.9% | 12.1% |
| Median | 6.9% | 10.2% |
| Interquartile 25% (IQ1) | 5.0% | 7.3% |
| Interquartile 75% (IQ3) | 8.6% | 12.8% |
| Interquartile Range (IQR) | 3.5% | 5.5% |
| Standard Deviation (Sample) | 3.0% | 9.6% |
| Standard Deviation (Population) | 3.0% | 9.5% |
Similar Demographics by Unemployment Among Women with Children Ages 6 to 17 years
Demographics Similar to Immigrants from Taiwan by Unemployment Among Women with Children Ages 6 to 17 years
In terms of unemployment among women with children ages 6 to 17 years, the demographic groups most similar to Immigrants from Taiwan are Bangladeshi (7.4%, a difference of 0.33%), Immigrants from Fiji (7.3%, a difference of 0.70%), Indonesian (7.4%, a difference of 1.0%), Sudanese (7.4%, a difference of 1.1%), and Assyrian/Chaldean/Syriac (7.2%, a difference of 1.7%).
| Demographics | Rating | Rank | Unemployment Among Women with Children Ages 6 to 17 years |
| Ute | 100.0 /100 | #4 | Exceptional 7.0% |
| Okinawans | 100.0 /100 | #5 | Exceptional 7.0% |
| Tlingit-Haida | 100.0 /100 | #6 | Exceptional 7.1% |
| Soviet Union | 100.0 /100 | #7 | Exceptional 7.1% |
| Immigrants | Hong Kong | 100.0 /100 | #8 | Exceptional 7.2% |
| Assyrians/Chaldeans/Syriacs | 100.0 /100 | #9 | Exceptional 7.2% |
| Immigrants | Fiji | 100.0 /100 | #10 | Exceptional 7.3% |
| Immigrants | Taiwan | 100.0 /100 | #11 | Exceptional 7.3% |
| Bangladeshis | 100.0 /100 | #12 | Exceptional 7.4% |
| Indonesians | 100.0 /100 | #13 | Exceptional 7.4% |
| Sudanese | 100.0 /100 | #14 | Exceptional 7.4% |
| Puget Sound Salish | 100.0 /100 | #15 | Exceptional 7.5% |
| Immigrants | Burma/Myanmar | 100.0 /100 | #16 | Exceptional 7.5% |
| Cambodians | 100.0 /100 | #17 | Exceptional 7.5% |
| Afghans | 100.0 /100 | #18 | Exceptional 7.6% |
Demographics Similar to U.S. Virgin Islanders by Unemployment Among Women with Children Ages 6 to 17 years
In terms of unemployment among women with children ages 6 to 17 years, the demographic groups most similar to U.S. Virgin Islanders are Immigrants from Portugal (9.7%, a difference of 0.010%), British West Indian (9.7%, a difference of 0.060%), French (9.7%, a difference of 0.13%), Scotch-Irish (9.7%, a difference of 0.17%), and Seminole (9.7%, a difference of 0.36%).
| Demographics | Rating | Rank | Unemployment Among Women with Children Ages 6 to 17 years |
| Ghanaians | 0.2 /100 | #268 | Tragic 9.6% |
| Blackfeet | 0.2 /100 | #269 | Tragic 9.6% |
| Immigrants | Nicaragua | 0.2 /100 | #270 | Tragic 9.6% |
| Immigrants | Latin America | 0.1 /100 | #271 | Tragic 9.6% |
| Kiowa | 0.1 /100 | #272 | Tragic 9.6% |
| Whites/Caucasians | 0.1 /100 | #273 | Tragic 9.6% |
| Aleuts | 0.1 /100 | #274 | Tragic 9.6% |
| U.S. Virgin Islanders | 0.1 /100 | #275 | Tragic 9.7% |
| Immigrants | Portugal | 0.1 /100 | #276 | Tragic 9.7% |
| British West Indians | 0.1 /100 | #277 | Tragic 9.7% |
| French | 0.1 /100 | #278 | Tragic 9.7% |
| Scotch-Irish | 0.1 /100 | #279 | Tragic 9.7% |
| Seminole | 0.1 /100 | #280 | Tragic 9.7% |
| Jamaicans | 0.0 /100 | #281 | Tragic 9.8% |
| Slovaks | 0.0 /100 | #282 | Tragic 9.8% |