Ottawa vs Immigrants from Micronesia Unemployment Among Women with Children Ages 6 to 17 years
COMPARE
Ottawa
Immigrants from Micronesia
Unemployment Among Women with Children Ages 6 to 17 years
Unemployment Among Women with Children Ages 6 to 17 years Comparison
Ottawa
Immigrants from Micronesia
10.9%
UNEMPLOYMENT AMONG WOMEN WITH CHILDREN AGES 6 TO 17 YEARS
0.0/ 100
METRIC RATING
328th/ 347
METRIC RANK
8.9%
UNEMPLOYMENT AMONG WOMEN WITH CHILDREN AGES 6 TO 17 YEARS
59.2/ 100
METRIC RATING
165th/ 347
METRIC RANK
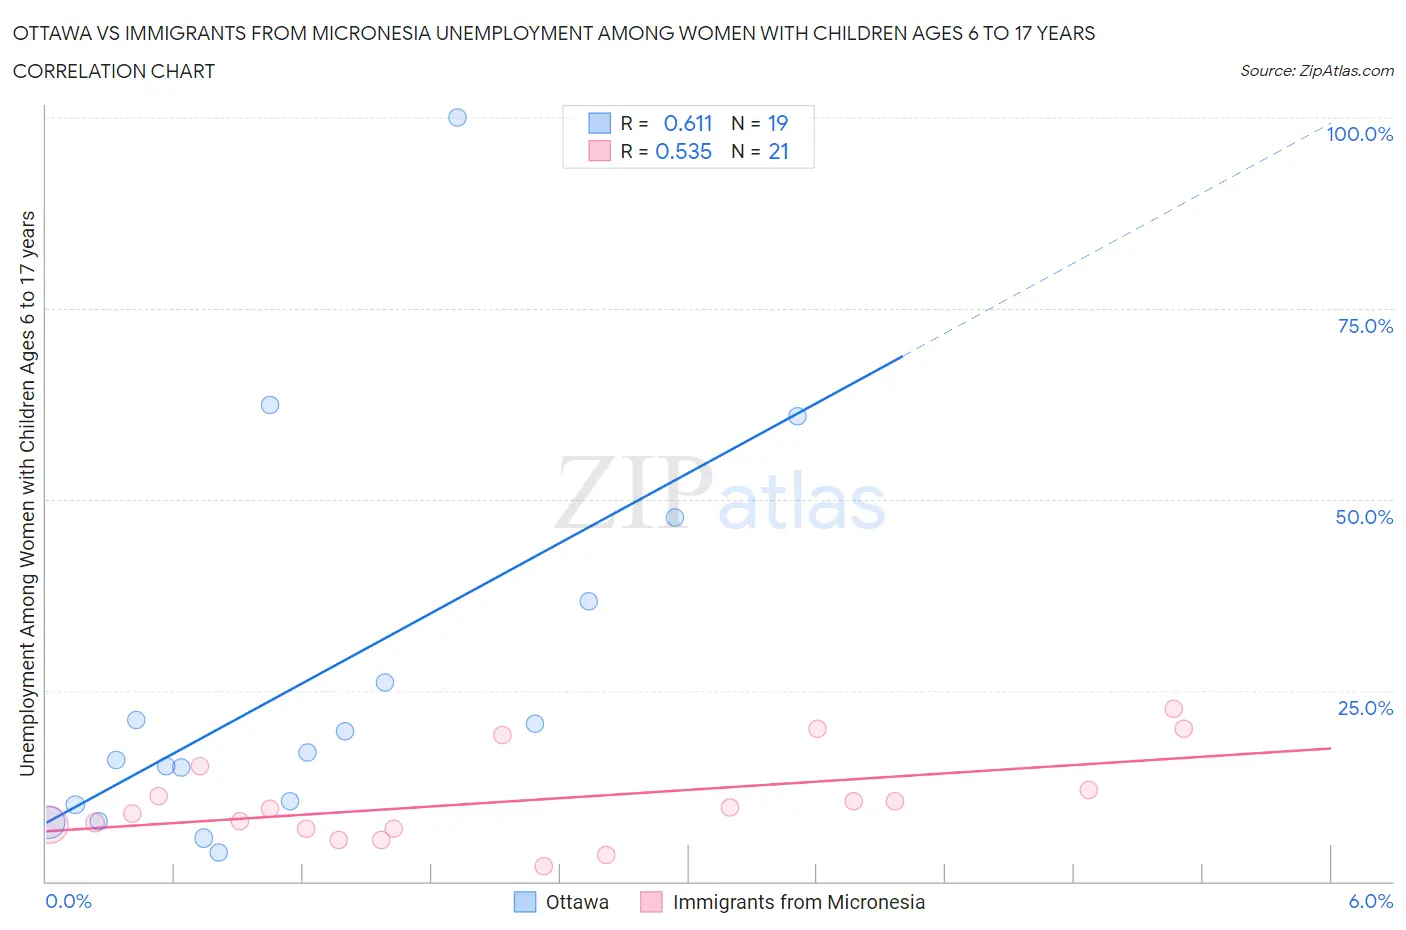
Ottawa vs Immigrants from Micronesia Unemployment Among Women with Children Ages 6 to 17 years Correlation Chart
The statistical analysis conducted on geographies consisting of 42,886,423 people shows a significant positive correlation between the proportion of Ottawa and unemployment rate among women with children between the ages 6 and 17 in the United States with a correlation coefficient (R) of 0.611 and weighted average of 10.9%. Similarly, the statistical analysis conducted on geographies consisting of 55,240,851 people shows a substantial positive correlation between the proportion of Immigrants from Micronesia and unemployment rate among women with children between the ages 6 and 17 in the United States with a correlation coefficient (R) of 0.535 and weighted average of 8.9%, a difference of 21.8%.
Unemployment Among Women with Children Ages 6 to 17 years Correlation Summary
| Measurement | Ottawa | Immigrants from Micronesia |
| Minimum | 3.7% | 2.0% |
| Maximum | 100.0% | 22.5% |
| Range | 96.3% | 20.5% |
| Mean | 26.5% | 10.6% |
| Median | 16.8% | 9.4% |
| Interquartile 25% (IQ1) | 10.0% | 6.9% |
| Interquartile 75% (IQ3) | 36.6% | 13.5% |
| Interquartile Range (IQR) | 26.6% | 6.7% |
| Standard Deviation (Sample) | 24.9% | 5.7% |
| Standard Deviation (Population) | 24.3% | 5.6% |
Similar Demographics by Unemployment Among Women with Children Ages 6 to 17 years
Demographics Similar to Ottawa by Unemployment Among Women with Children Ages 6 to 17 years
In terms of unemployment among women with children ages 6 to 17 years, the demographic groups most similar to Ottawa are Cape Verdean (10.9%, a difference of 0.14%), Liberian (10.8%, a difference of 0.20%), Cajun (10.8%, a difference of 0.27%), Immigrants from Dominican Republic (10.8%, a difference of 0.46%), and Dominican (10.8%, a difference of 0.52%).
| Demographics | Rating | Rank | Unemployment Among Women with Children Ages 6 to 17 years |
| Tohono O'odham | 0.0 /100 | #321 | Tragic 10.7% |
| Cree | 0.0 /100 | #322 | Tragic 10.8% |
| Dominicans | 0.0 /100 | #323 | Tragic 10.8% |
| Immigrants | Dominican Republic | 0.0 /100 | #324 | Tragic 10.8% |
| Cajuns | 0.0 /100 | #325 | Tragic 10.8% |
| Liberians | 0.0 /100 | #326 | Tragic 10.8% |
| Cape Verdeans | 0.0 /100 | #327 | Tragic 10.9% |
| Ottawa | 0.0 /100 | #328 | Tragic 10.9% |
| Pennsylvania Germans | 0.0 /100 | #329 | Tragic 11.0% |
| Chippewa | 0.0 /100 | #330 | Tragic 11.1% |
| Blacks/African Americans | 0.0 /100 | #331 | Tragic 11.4% |
| Tsimshian | 0.0 /100 | #332 | Tragic 11.4% |
| Natives/Alaskans | 0.0 /100 | #333 | Tragic 11.5% |
| Ugandans | 0.0 /100 | #334 | Tragic 12.0% |
| Colville | 0.0 /100 | #335 | Tragic 12.3% |
Demographics Similar to Immigrants from Micronesia by Unemployment Among Women with Children Ages 6 to 17 years
In terms of unemployment among women with children ages 6 to 17 years, the demographic groups most similar to Immigrants from Micronesia are Ukrainian (8.9%, a difference of 0.020%), Moroccan (8.9%, a difference of 0.040%), Mexican American Indian (8.9%, a difference of 0.060%), Immigrants from Netherlands (8.9%, a difference of 0.070%), and Immigrants from England (8.9%, a difference of 0.070%).
| Demographics | Rating | Rank | Unemployment Among Women with Children Ages 6 to 17 years |
| Immigrants | Chile | 65.3 /100 | #158 | Good 8.9% |
| Spanish | 63.8 /100 | #159 | Good 8.9% |
| Immigrants | Hungary | 63.4 /100 | #160 | Good 8.9% |
| Immigrants | Guyana | 63.0 /100 | #161 | Good 8.9% |
| Immigrants | Netherlands | 60.8 /100 | #162 | Good 8.9% |
| Mexican American Indians | 60.6 /100 | #163 | Good 8.9% |
| Ukrainians | 59.7 /100 | #164 | Average 8.9% |
| Immigrants | Micronesia | 59.2 /100 | #165 | Average 8.9% |
| Moroccans | 58.3 /100 | #166 | Average 8.9% |
| Immigrants | England | 57.7 /100 | #167 | Average 8.9% |
| Immigrants | Croatia | 57.1 /100 | #168 | Average 8.9% |
| British | 55.2 /100 | #169 | Average 8.9% |
| Turks | 54.1 /100 | #170 | Average 8.9% |
| Jordanians | 52.2 /100 | #171 | Average 9.0% |
| Immigrants | West Indies | 52.2 /100 | #172 | Average 9.0% |