New Zealander vs Sudanese Unemployment
COMPARE
New Zealander
Sudanese
Unemployment
Unemployment Comparison
New Zealanders
Sudanese
4.9%
UNEMPLOYMENT
98.6/ 100
METRIC RATING
67th/ 347
METRIC RANK
4.8%
UNEMPLOYMENT
99.8/ 100
METRIC RATING
33rd/ 347
METRIC RANK
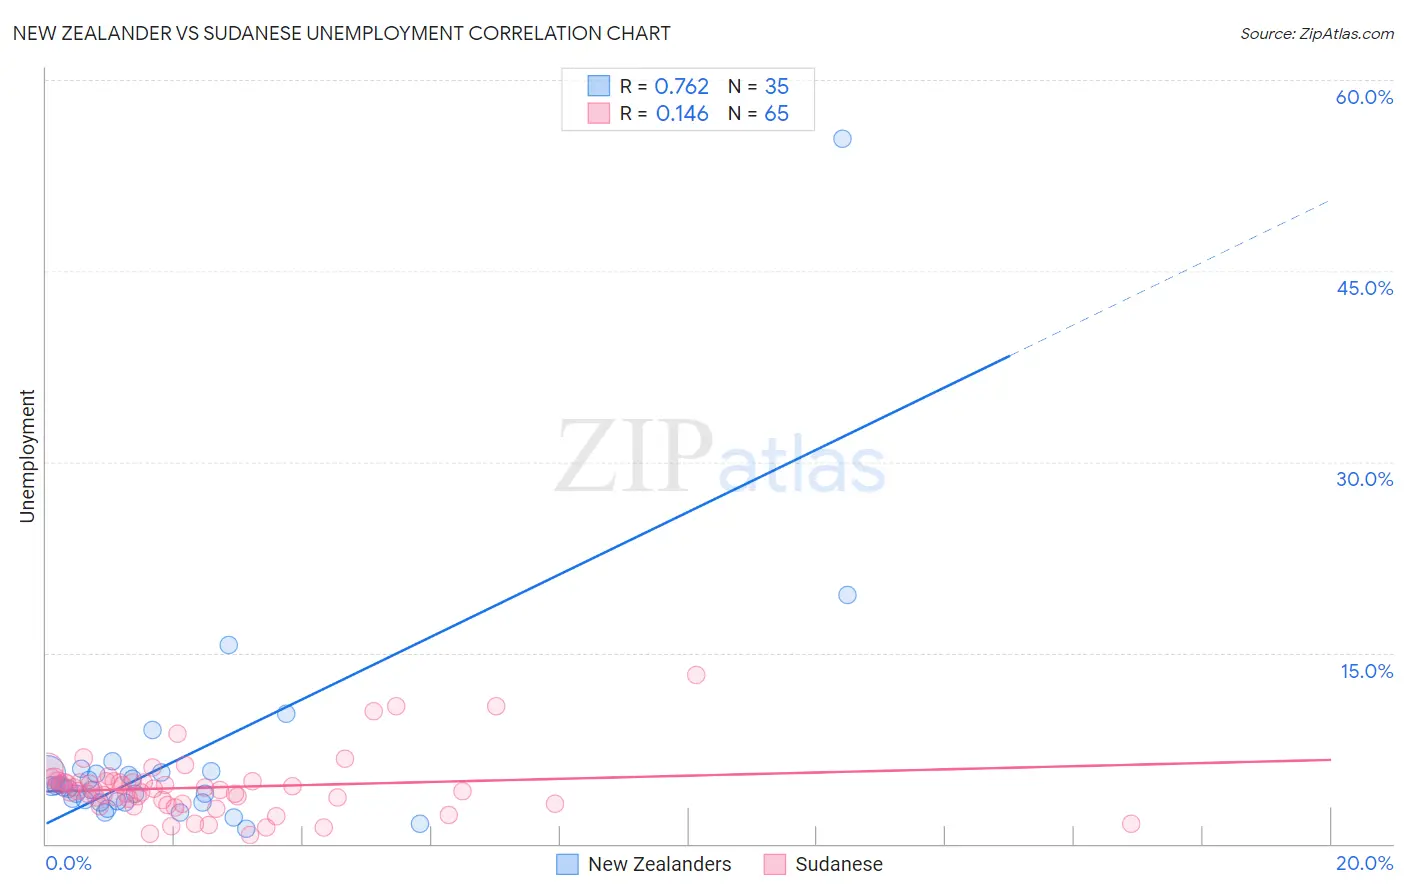
New Zealander vs Sudanese Unemployment Correlation Chart
The statistical analysis conducted on geographies consisting of 106,884,587 people shows a strong positive correlation between the proportion of New Zealanders and unemployment in the United States with a correlation coefficient (R) of 0.762 and weighted average of 4.9%. Similarly, the statistical analysis conducted on geographies consisting of 110,101,890 people shows a poor positive correlation between the proportion of Sudanese and unemployment in the United States with a correlation coefficient (R) of 0.146 and weighted average of 4.8%, a difference of 3.2%.
Unemployment Correlation Summary
| Measurement | New Zealander | Sudanese |
| Minimum | 1.2% | 0.70% |
| Maximum | 55.4% | 13.3% |
| Range | 54.2% | 12.6% |
| Mean | 6.6% | 4.4% |
| Median | 4.4% | 4.2% |
| Interquartile 25% (IQ1) | 3.3% | 3.1% |
| Interquartile 75% (IQ3) | 5.6% | 4.9% |
| Interquartile Range (IQR) | 2.3% | 1.8% |
| Standard Deviation (Sample) | 9.2% | 2.3% |
| Standard Deviation (Population) | 9.1% | 2.3% |
Similar Demographics by Unemployment
Demographics Similar to New Zealanders by Unemployment
In terms of unemployment, the demographic groups most similar to New Zealanders are Slavic (4.9%, a difference of 0.030%), Slovak (4.9%, a difference of 0.040%), Immigrants from North America (4.9%, a difference of 0.12%), Immigrants from Canada (4.9%, a difference of 0.19%), and Serbian (4.9%, a difference of 0.27%).
| Demographics | Rating | Rank | Unemployment |
| Immigrants | Netherlands | 99.0 /100 | #60 | Exceptional 4.9% |
| Cambodians | 99.0 /100 | #61 | Exceptional 4.9% |
| Icelanders | 98.9 /100 | #62 | Exceptional 4.9% |
| Immigrants | Bulgaria | 98.9 /100 | #63 | Exceptional 4.9% |
| Italians | 98.9 /100 | #64 | Exceptional 4.9% |
| Immigrants | Canada | 98.8 /100 | #65 | Exceptional 4.9% |
| Slovaks | 98.7 /100 | #66 | Exceptional 4.9% |
| New Zealanders | 98.6 /100 | #67 | Exceptional 4.9% |
| Slavs | 98.6 /100 | #68 | Exceptional 4.9% |
| Immigrants | North America | 98.5 /100 | #69 | Exceptional 4.9% |
| Serbians | 98.4 /100 | #70 | Exceptional 4.9% |
| Immigrants | Japan | 98.3 /100 | #71 | Exceptional 4.9% |
| Burmese | 98.3 /100 | #72 | Exceptional 4.9% |
| Paraguayans | 98.3 /100 | #73 | Exceptional 4.9% |
| Immigrants | Northern Europe | 98.2 /100 | #74 | Exceptional 4.9% |
Demographics Similar to Sudanese by Unemployment
In terms of unemployment, the demographic groups most similar to Sudanese are Zimbabwean (4.8%, a difference of 0.010%), Immigrants from Bolivia (4.8%, a difference of 0.040%), Croatian (4.8%, a difference of 0.11%), Scotch-Irish (4.8%, a difference of 0.11%), and Irish (4.8%, a difference of 0.13%).
| Demographics | Rating | Rank | Unemployment |
| Bulgarians | 99.9 /100 | #26 | Exceptional 4.7% |
| Finns | 99.9 /100 | #27 | Exceptional 4.7% |
| Cubans | 99.8 /100 | #28 | Exceptional 4.7% |
| Poles | 99.8 /100 | #29 | Exceptional 4.7% |
| Irish | 99.8 /100 | #30 | Exceptional 4.8% |
| Croatians | 99.8 /100 | #31 | Exceptional 4.8% |
| Zimbabweans | 99.8 /100 | #32 | Exceptional 4.8% |
| Sudanese | 99.8 /100 | #33 | Exceptional 4.8% |
| Immigrants | Bolivia | 99.8 /100 | #34 | Exceptional 4.8% |
| Scotch-Irish | 99.8 /100 | #35 | Exceptional 4.8% |
| Tongans | 99.7 /100 | #36 | Exceptional 4.8% |
| Czechoslovakians | 99.7 /100 | #37 | Exceptional 4.8% |
| Bolivians | 99.7 /100 | #38 | Exceptional 4.8% |
| Lithuanians | 99.7 /100 | #39 | Exceptional 4.8% |
| Northern Europeans | 99.7 /100 | #40 | Exceptional 4.8% |