Turkish vs Sudanese Unemployment
COMPARE
Turkish
Sudanese
Unemployment
Unemployment Comparison
Turks
Sudanese
4.9%
UNEMPLOYMENT
98.0/ 100
METRIC RATING
75th/ 347
METRIC RANK
4.8%
UNEMPLOYMENT
99.8/ 100
METRIC RATING
33rd/ 347
METRIC RANK
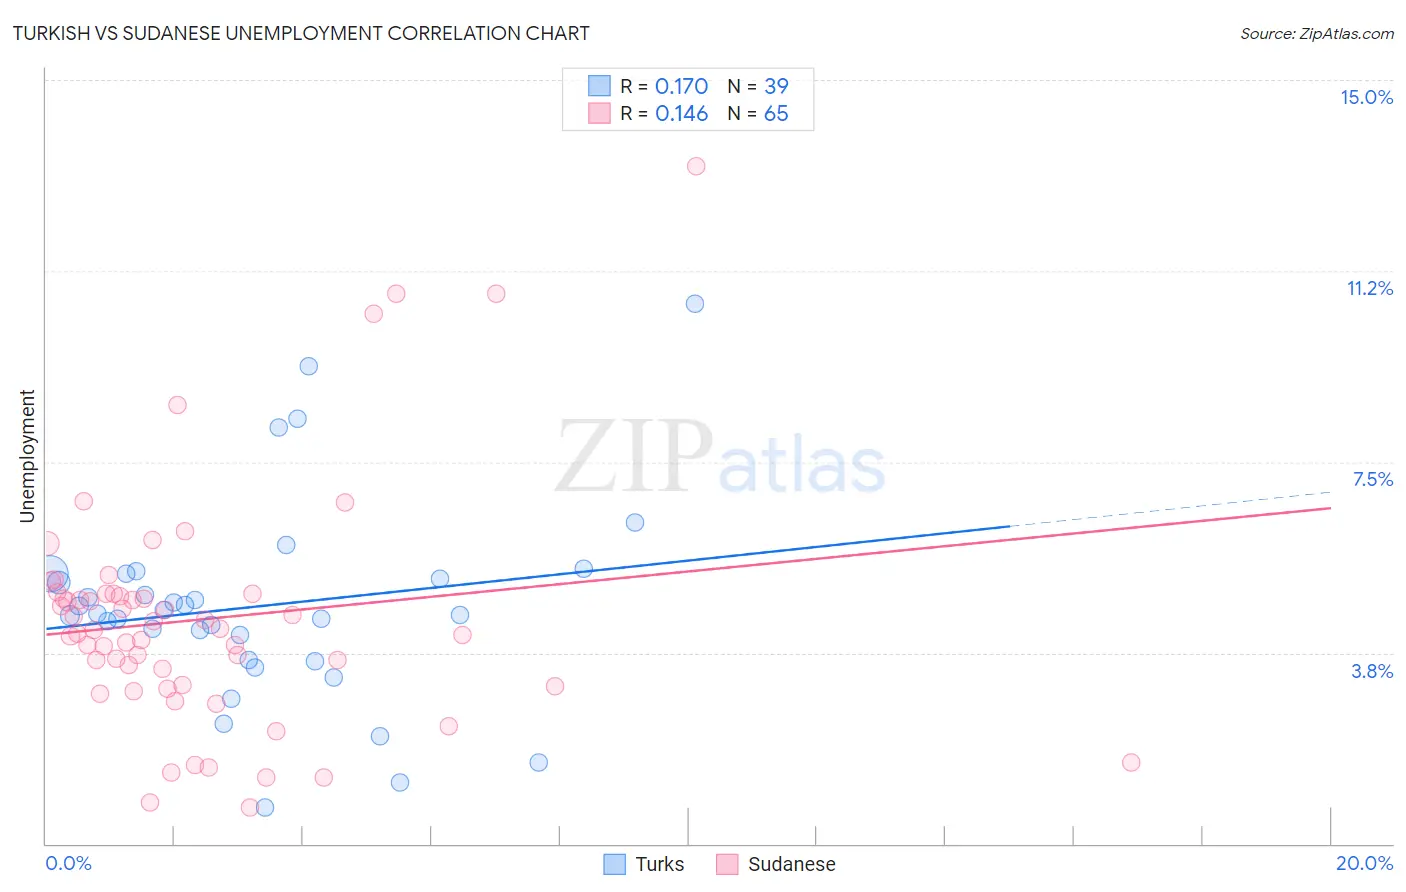
Turkish vs Sudanese Unemployment Correlation Chart
The statistical analysis conducted on geographies consisting of 271,755,353 people shows a poor positive correlation between the proportion of Turks and unemployment in the United States with a correlation coefficient (R) of 0.170 and weighted average of 4.9%. Similarly, the statistical analysis conducted on geographies consisting of 110,101,890 people shows a poor positive correlation between the proportion of Sudanese and unemployment in the United States with a correlation coefficient (R) of 0.146 and weighted average of 4.8%, a difference of 3.8%.
Unemployment Correlation Summary
| Measurement | Turkish | Sudanese |
| Minimum | 0.70% | 0.70% |
| Maximum | 10.6% | 13.3% |
| Range | 9.9% | 12.6% |
| Mean | 4.7% | 4.4% |
| Median | 4.5% | 4.2% |
| Interquartile 25% (IQ1) | 3.6% | 3.1% |
| Interquartile 75% (IQ3) | 5.3% | 4.9% |
| Interquartile Range (IQR) | 1.7% | 1.8% |
| Standard Deviation (Sample) | 2.0% | 2.3% |
| Standard Deviation (Population) | 2.0% | 2.3% |
Similar Demographics by Unemployment
Demographics Similar to Turks by Unemployment
In terms of unemployment, the demographic groups most similar to Turks are German Russian (4.9%, a difference of 0.030%), Cypriot (4.9%, a difference of 0.080%), Immigrants from Northern Europe (4.9%, a difference of 0.13%), Okinawan (4.9%, a difference of 0.13%), and Paraguayan (4.9%, a difference of 0.23%).
| Demographics | Rating | Rank | Unemployment |
| Slavs | 98.6 /100 | #68 | Exceptional 4.9% |
| Immigrants | North America | 98.5 /100 | #69 | Exceptional 4.9% |
| Serbians | 98.4 /100 | #70 | Exceptional 4.9% |
| Immigrants | Japan | 98.3 /100 | #71 | Exceptional 4.9% |
| Burmese | 98.3 /100 | #72 | Exceptional 4.9% |
| Paraguayans | 98.3 /100 | #73 | Exceptional 4.9% |
| Immigrants | Northern Europe | 98.2 /100 | #74 | Exceptional 4.9% |
| Turks | 98.0 /100 | #75 | Exceptional 4.9% |
| German Russians | 98.0 /100 | #76 | Exceptional 4.9% |
| Cypriots | 97.9 /100 | #77 | Exceptional 4.9% |
| Okinawans | 97.9 /100 | #78 | Exceptional 4.9% |
| Canadians | 97.7 /100 | #79 | Exceptional 5.0% |
| Immigrants | Sweden | 97.6 /100 | #80 | Exceptional 5.0% |
| Basques | 97.6 /100 | #81 | Exceptional 5.0% |
| Fijians | 97.6 /100 | #82 | Exceptional 5.0% |
Demographics Similar to Sudanese by Unemployment
In terms of unemployment, the demographic groups most similar to Sudanese are Zimbabwean (4.8%, a difference of 0.010%), Immigrants from Bolivia (4.8%, a difference of 0.040%), Croatian (4.8%, a difference of 0.11%), Scotch-Irish (4.8%, a difference of 0.11%), and Irish (4.8%, a difference of 0.13%).
| Demographics | Rating | Rank | Unemployment |
| Bulgarians | 99.9 /100 | #26 | Exceptional 4.7% |
| Finns | 99.9 /100 | #27 | Exceptional 4.7% |
| Cubans | 99.8 /100 | #28 | Exceptional 4.7% |
| Poles | 99.8 /100 | #29 | Exceptional 4.7% |
| Irish | 99.8 /100 | #30 | Exceptional 4.8% |
| Croatians | 99.8 /100 | #31 | Exceptional 4.8% |
| Zimbabweans | 99.8 /100 | #32 | Exceptional 4.8% |
| Sudanese | 99.8 /100 | #33 | Exceptional 4.8% |
| Immigrants | Bolivia | 99.8 /100 | #34 | Exceptional 4.8% |
| Scotch-Irish | 99.8 /100 | #35 | Exceptional 4.8% |
| Tongans | 99.7 /100 | #36 | Exceptional 4.8% |
| Czechoslovakians | 99.7 /100 | #37 | Exceptional 4.8% |
| Bolivians | 99.7 /100 | #38 | Exceptional 4.8% |
| Lithuanians | 99.7 /100 | #39 | Exceptional 4.8% |
| Northern Europeans | 99.7 /100 | #40 | Exceptional 4.8% |