New Zealander vs Immigrants from Zimbabwe Unemployment
COMPARE
New Zealander
Immigrants from Zimbabwe
Unemployment
Unemployment Comparison
New Zealanders
Immigrants from Zimbabwe
4.9%
UNEMPLOYMENT
98.6/ 100
METRIC RATING
67th/ 347
METRIC RANK
4.9%
UNEMPLOYMENT
99.2/ 100
METRIC RATING
53rd/ 347
METRIC RANK
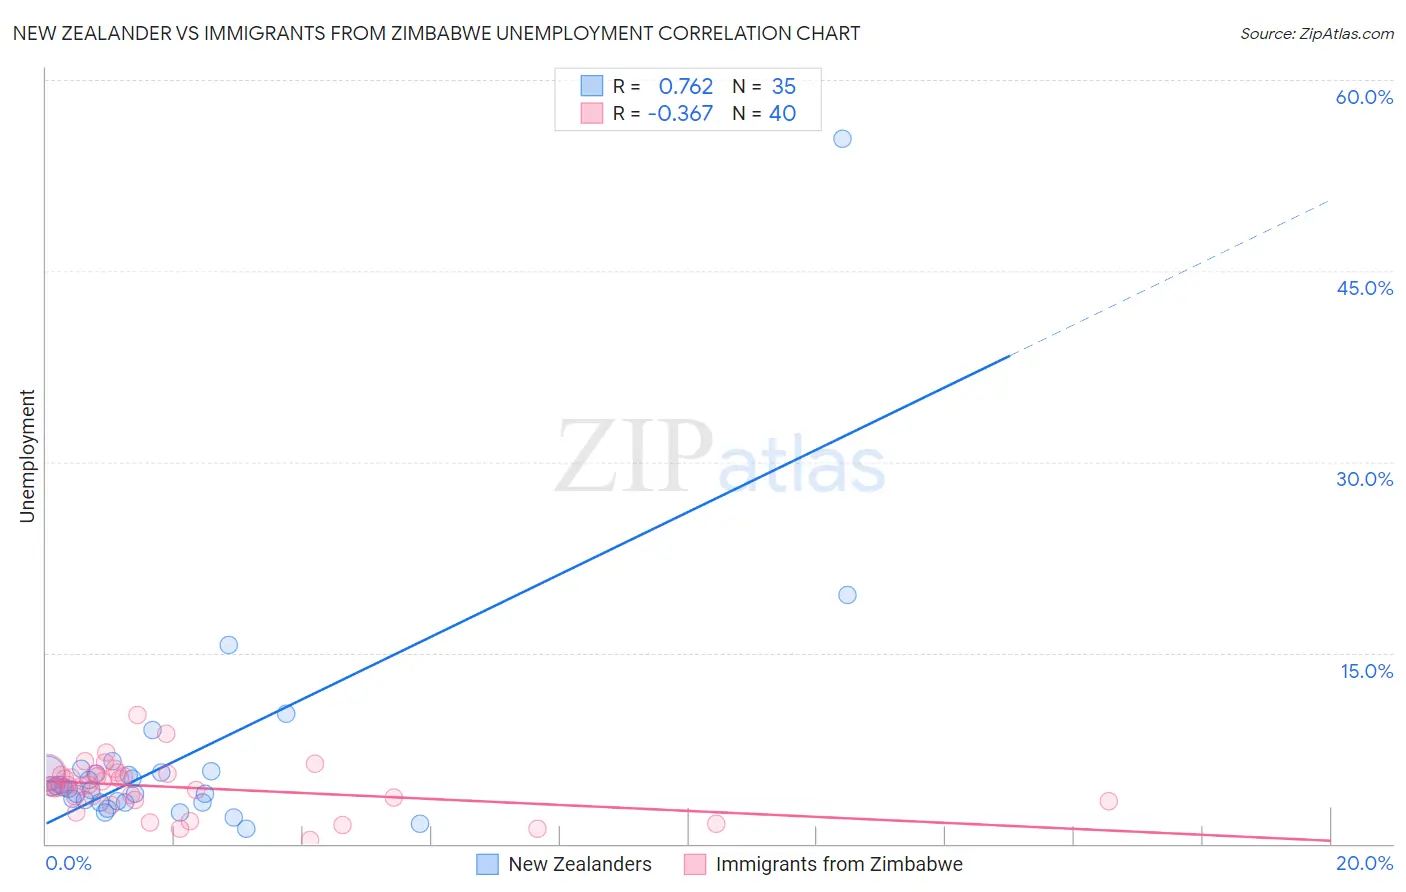
New Zealander vs Immigrants from Zimbabwe Unemployment Correlation Chart
The statistical analysis conducted on geographies consisting of 106,884,587 people shows a strong positive correlation between the proportion of New Zealanders and unemployment in the United States with a correlation coefficient (R) of 0.762 and weighted average of 4.9%. Similarly, the statistical analysis conducted on geographies consisting of 117,788,083 people shows a mild negative correlation between the proportion of Immigrants from Zimbabwe and unemployment in the United States with a correlation coefficient (R) of -0.367 and weighted average of 4.9%, a difference of 0.91%.
Unemployment Correlation Summary
| Measurement | New Zealander | Immigrants from Zimbabwe |
| Minimum | 1.2% | 0.30% |
| Maximum | 55.4% | 10.1% |
| Range | 54.2% | 9.8% |
| Mean | 6.6% | 4.4% |
| Median | 4.4% | 4.6% |
| Interquartile 25% (IQ1) | 3.3% | 3.4% |
| Interquartile 75% (IQ3) | 5.6% | 5.5% |
| Interquartile Range (IQR) | 2.3% | 2.1% |
| Standard Deviation (Sample) | 9.2% | 2.0% |
| Standard Deviation (Population) | 9.1% | 2.0% |
Demographics Similar to New Zealanders and Immigrants from Zimbabwe by Unemployment
In terms of unemployment, the demographic groups most similar to New Zealanders are Slavic (4.9%, a difference of 0.030%), Slovak (4.9%, a difference of 0.040%), Immigrants from North America (4.9%, a difference of 0.12%), Immigrants from Canada (4.9%, a difference of 0.19%), and Serbian (4.9%, a difference of 0.27%). Similarly, the demographic groups most similar to Immigrants from Zimbabwe are White/Caucasian (4.9%, a difference of 0.030%), Eastern European (4.9%, a difference of 0.030%), Immigrants from Belgium (4.9%, a difference of 0.040%), Australian (4.9%, a difference of 0.060%), and French Canadian (4.9%, a difference of 0.20%).
| Demographics | Rating | Rank | Unemployment |
| French Canadians | 99.3 /100 | #50 | Exceptional 4.9% |
| Immigrants | Belgium | 99.2 /100 | #51 | Exceptional 4.9% |
| Whites/Caucasians | 99.2 /100 | #52 | Exceptional 4.9% |
| Immigrants | Zimbabwe | 99.2 /100 | #53 | Exceptional 4.9% |
| Eastern Europeans | 99.2 /100 | #54 | Exceptional 4.9% |
| Australians | 99.2 /100 | #55 | Exceptional 4.9% |
| Celtics | 99.1 /100 | #56 | Exceptional 4.9% |
| Immigrants | Singapore | 99.1 /100 | #57 | Exceptional 4.9% |
| Greeks | 99.0 /100 | #58 | Exceptional 4.9% |
| Bhutanese | 99.0 /100 | #59 | Exceptional 4.9% |
| Immigrants | Netherlands | 99.0 /100 | #60 | Exceptional 4.9% |
| Cambodians | 99.0 /100 | #61 | Exceptional 4.9% |
| Icelanders | 98.9 /100 | #62 | Exceptional 4.9% |
| Immigrants | Bulgaria | 98.9 /100 | #63 | Exceptional 4.9% |
| Italians | 98.9 /100 | #64 | Exceptional 4.9% |
| Immigrants | Canada | 98.8 /100 | #65 | Exceptional 4.9% |
| Slovaks | 98.7 /100 | #66 | Exceptional 4.9% |
| New Zealanders | 98.6 /100 | #67 | Exceptional 4.9% |
| Slavs | 98.6 /100 | #68 | Exceptional 4.9% |
| Immigrants | North America | 98.5 /100 | #69 | Exceptional 4.9% |
| Serbians | 98.4 /100 | #70 | Exceptional 4.9% |