New Zealander vs European Unemployment
COMPARE
New Zealander
European
Unemployment
Unemployment Comparison
New Zealanders
Europeans
4.9%
UNEMPLOYMENT
98.6/ 100
METRIC RATING
67th/ 347
METRIC RANK
4.6%
UNEMPLOYMENT
99.9/ 100
METRIC RATING
15th/ 347
METRIC RANK
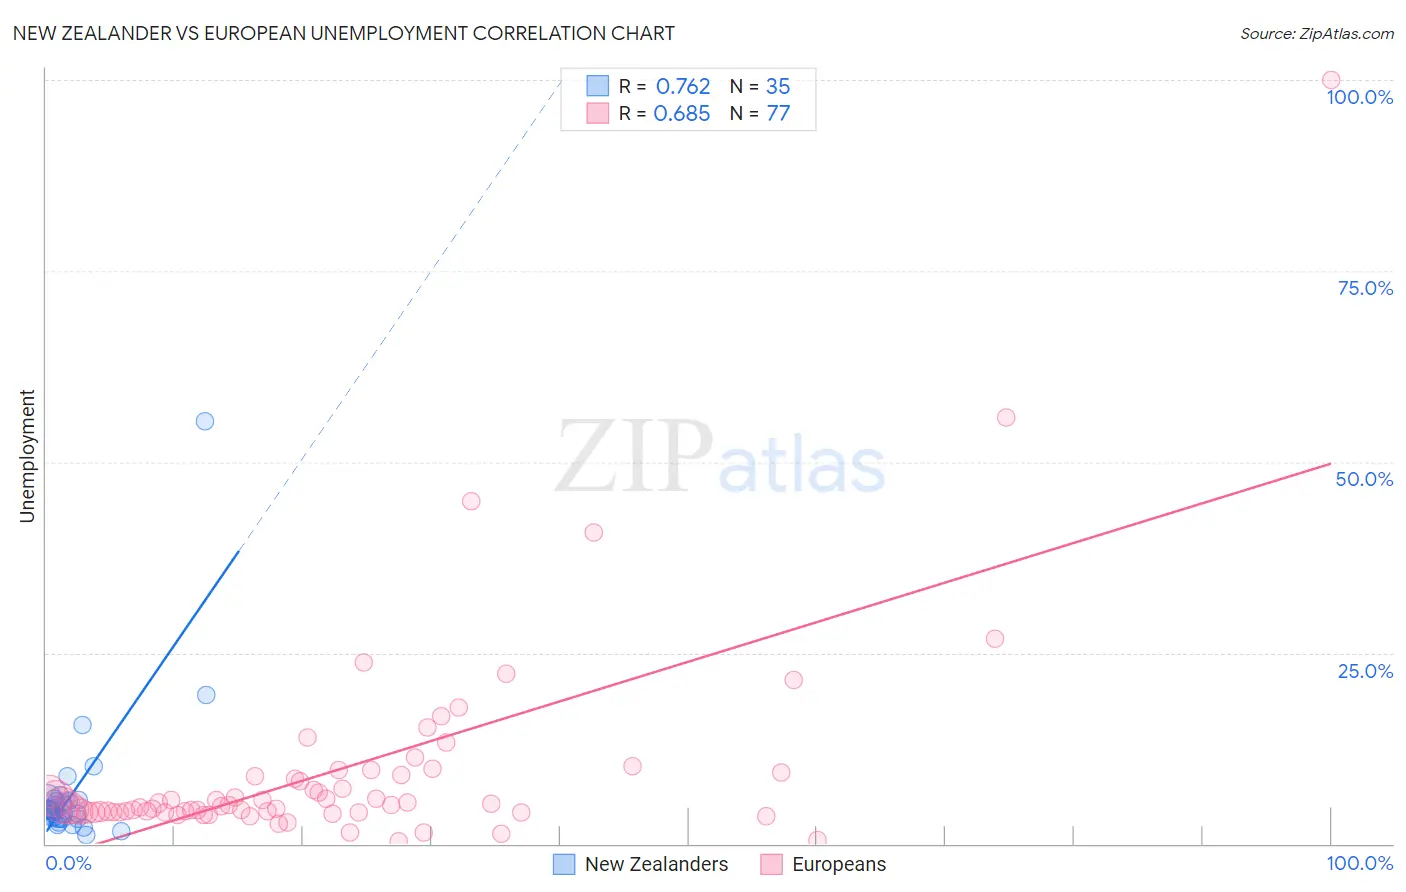
New Zealander vs European Unemployment Correlation Chart
The statistical analysis conducted on geographies consisting of 106,884,587 people shows a strong positive correlation between the proportion of New Zealanders and unemployment in the United States with a correlation coefficient (R) of 0.762 and weighted average of 4.9%. Similarly, the statistical analysis conducted on geographies consisting of 558,532,246 people shows a significant positive correlation between the proportion of Europeans and unemployment in the United States with a correlation coefficient (R) of 0.685 and weighted average of 4.6%, a difference of 5.7%.
Unemployment Correlation Summary
| Measurement | New Zealander | European |
| Minimum | 1.2% | 0.40% |
| Maximum | 55.4% | 100.0% |
| Range | 54.2% | 99.6% |
| Mean | 6.6% | 9.7% |
| Median | 4.4% | 5.0% |
| Interquartile 25% (IQ1) | 3.3% | 4.2% |
| Interquartile 75% (IQ3) | 5.6% | 9.2% |
| Interquartile Range (IQR) | 2.3% | 5.0% |
| Standard Deviation (Sample) | 9.2% | 14.1% |
| Standard Deviation (Population) | 9.1% | 14.0% |
Similar Demographics by Unemployment
Demographics Similar to New Zealanders by Unemployment
In terms of unemployment, the demographic groups most similar to New Zealanders are Slavic (4.9%, a difference of 0.030%), Slovak (4.9%, a difference of 0.040%), Immigrants from North America (4.9%, a difference of 0.12%), Immigrants from Canada (4.9%, a difference of 0.19%), and Serbian (4.9%, a difference of 0.27%).
| Demographics | Rating | Rank | Unemployment |
| Immigrants | Netherlands | 99.0 /100 | #60 | Exceptional 4.9% |
| Cambodians | 99.0 /100 | #61 | Exceptional 4.9% |
| Icelanders | 98.9 /100 | #62 | Exceptional 4.9% |
| Immigrants | Bulgaria | 98.9 /100 | #63 | Exceptional 4.9% |
| Italians | 98.9 /100 | #64 | Exceptional 4.9% |
| Immigrants | Canada | 98.8 /100 | #65 | Exceptional 4.9% |
| Slovaks | 98.7 /100 | #66 | Exceptional 4.9% |
| New Zealanders | 98.6 /100 | #67 | Exceptional 4.9% |
| Slavs | 98.6 /100 | #68 | Exceptional 4.9% |
| Immigrants | North America | 98.5 /100 | #69 | Exceptional 4.9% |
| Serbians | 98.4 /100 | #70 | Exceptional 4.9% |
| Immigrants | Japan | 98.3 /100 | #71 | Exceptional 4.9% |
| Burmese | 98.3 /100 | #72 | Exceptional 4.9% |
| Paraguayans | 98.3 /100 | #73 | Exceptional 4.9% |
| Immigrants | Northern Europe | 98.2 /100 | #74 | Exceptional 4.9% |
Demographics Similar to Europeans by Unemployment
In terms of unemployment, the demographic groups most similar to Europeans are Chinese (4.7%, a difference of 0.14%), Slovene (4.7%, a difference of 0.24%), Immigrants from Venezuela (4.7%, a difference of 0.27%), Scottish (4.7%, a difference of 0.35%), and Immigrants from Cuba (4.6%, a difference of 0.48%).
| Demographics | Rating | Rank | Unemployment |
| Swiss | 100.0 /100 | #8 | Exceptional 4.5% |
| Scandinavians | 100.0 /100 | #9 | Exceptional 4.5% |
| Dutch | 100.0 /100 | #10 | Exceptional 4.6% |
| English | 100.0 /100 | #11 | Exceptional 4.6% |
| Pennsylvania Germans | 100.0 /100 | #12 | Exceptional 4.6% |
| Belgians | 100.0 /100 | #13 | Exceptional 4.6% |
| Immigrants | Cuba | 100.0 /100 | #14 | Exceptional 4.6% |
| Europeans | 99.9 /100 | #15 | Exceptional 4.6% |
| Chinese | 99.9 /100 | #16 | Exceptional 4.7% |
| Slovenes | 99.9 /100 | #17 | Exceptional 4.7% |
| Immigrants | Venezuela | 99.9 /100 | #18 | Exceptional 4.7% |
| Scottish | 99.9 /100 | #19 | Exceptional 4.7% |
| Carpatho Rusyns | 99.9 /100 | #20 | Exceptional 4.7% |
| Welsh | 99.9 /100 | #21 | Exceptional 4.7% |
| Thais | 99.9 /100 | #22 | Exceptional 4.7% |