Immigrants from Guatemala vs Sudanese Unemployment
COMPARE
Immigrants from Guatemala
Sudanese
Unemployment
Unemployment Comparison
Immigrants from Guatemala
Sudanese
5.8%
UNEMPLOYMENT
0.1/ 100
METRIC RATING
261st/ 347
METRIC RANK
4.8%
UNEMPLOYMENT
99.8/ 100
METRIC RATING
33rd/ 347
METRIC RANK
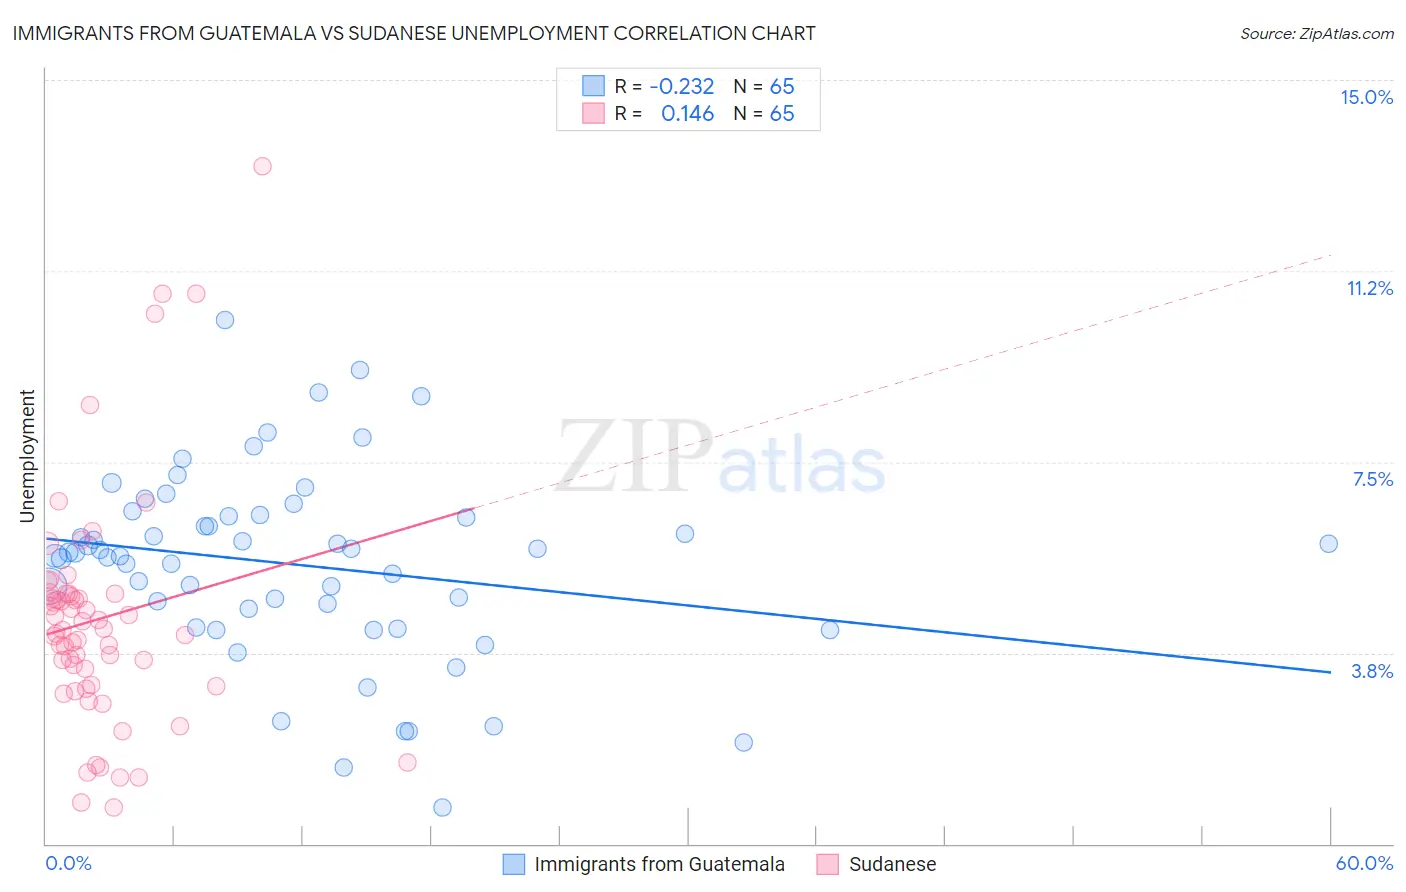
Immigrants from Guatemala vs Sudanese Unemployment Correlation Chart
The statistical analysis conducted on geographies consisting of 376,960,601 people shows a weak negative correlation between the proportion of Immigrants from Guatemala and unemployment in the United States with a correlation coefficient (R) of -0.232 and weighted average of 5.8%. Similarly, the statistical analysis conducted on geographies consisting of 110,101,890 people shows a poor positive correlation between the proportion of Sudanese and unemployment in the United States with a correlation coefficient (R) of 0.146 and weighted average of 4.8%, a difference of 21.7%.
Unemployment Correlation Summary
| Measurement | Immigrants from Guatemala | Sudanese |
| Minimum | 0.70% | 0.70% |
| Maximum | 10.3% | 13.3% |
| Range | 9.6% | 12.6% |
| Mean | 5.5% | 4.4% |
| Median | 5.7% | 4.2% |
| Interquartile 25% (IQ1) | 4.4% | 3.1% |
| Interquartile 75% (IQ3) | 6.4% | 4.9% |
| Interquartile Range (IQR) | 2.0% | 1.8% |
| Standard Deviation (Sample) | 1.9% | 2.3% |
| Standard Deviation (Population) | 1.8% | 2.3% |
Similar Demographics by Unemployment
Demographics Similar to Immigrants from Guatemala by Unemployment
In terms of unemployment, the demographic groups most similar to Immigrants from Guatemala are Immigrants from Uzbekistan (5.8%, a difference of 0.020%), Subsaharan African (5.8%, a difference of 0.040%), Sierra Leonean (5.8%, a difference of 0.10%), Salvadoran (5.8%, a difference of 0.13%), and Immigrants from Bahamas (5.8%, a difference of 0.16%).
| Demographics | Rating | Rank | Unemployment |
| Immigrants | Honduras | 0.3 /100 | #254 | Tragic 5.7% |
| Immigrants | Portugal | 0.2 /100 | #255 | Tragic 5.7% |
| Guatemalans | 0.2 /100 | #256 | Tragic 5.8% |
| Yaqui | 0.2 /100 | #257 | Tragic 5.8% |
| Immigrants | Bahamas | 0.1 /100 | #258 | Tragic 5.8% |
| Sub-Saharan Africans | 0.1 /100 | #259 | Tragic 5.8% |
| Immigrants | Uzbekistan | 0.1 /100 | #260 | Tragic 5.8% |
| Immigrants | Guatemala | 0.1 /100 | #261 | Tragic 5.8% |
| Sierra Leoneans | 0.1 /100 | #262 | Tragic 5.8% |
| Salvadorans | 0.1 /100 | #263 | Tragic 5.8% |
| Immigrants | Liberia | 0.1 /100 | #264 | Tragic 5.8% |
| Nigerians | 0.1 /100 | #265 | Tragic 5.8% |
| Mexican American Indians | 0.1 /100 | #266 | Tragic 5.8% |
| Immigrants | Nigeria | 0.1 /100 | #267 | Tragic 5.8% |
| Immigrants | Sierra Leone | 0.1 /100 | #268 | Tragic 5.8% |
Demographics Similar to Sudanese by Unemployment
In terms of unemployment, the demographic groups most similar to Sudanese are Zimbabwean (4.8%, a difference of 0.010%), Immigrants from Bolivia (4.8%, a difference of 0.040%), Croatian (4.8%, a difference of 0.11%), Scotch-Irish (4.8%, a difference of 0.11%), and Irish (4.8%, a difference of 0.13%).
| Demographics | Rating | Rank | Unemployment |
| Bulgarians | 99.9 /100 | #26 | Exceptional 4.7% |
| Finns | 99.9 /100 | #27 | Exceptional 4.7% |
| Cubans | 99.8 /100 | #28 | Exceptional 4.7% |
| Poles | 99.8 /100 | #29 | Exceptional 4.7% |
| Irish | 99.8 /100 | #30 | Exceptional 4.8% |
| Croatians | 99.8 /100 | #31 | Exceptional 4.8% |
| Zimbabweans | 99.8 /100 | #32 | Exceptional 4.8% |
| Sudanese | 99.8 /100 | #33 | Exceptional 4.8% |
| Immigrants | Bolivia | 99.8 /100 | #34 | Exceptional 4.8% |
| Scotch-Irish | 99.8 /100 | #35 | Exceptional 4.8% |
| Tongans | 99.7 /100 | #36 | Exceptional 4.8% |
| Czechoslovakians | 99.7 /100 | #37 | Exceptional 4.8% |
| Bolivians | 99.7 /100 | #38 | Exceptional 4.8% |
| Lithuanians | 99.7 /100 | #39 | Exceptional 4.8% |
| Northern Europeans | 99.7 /100 | #40 | Exceptional 4.8% |