New Zealander vs Immigrants from Nepal Unemployment
COMPARE
New Zealander
Immigrants from Nepal
Unemployment
Unemployment Comparison
New Zealanders
Immigrants from Nepal
4.9%
UNEMPLOYMENT
98.6/ 100
METRIC RATING
67th/ 347
METRIC RANK
4.8%
UNEMPLOYMENT
99.4/ 100
METRIC RATING
46th/ 347
METRIC RANK
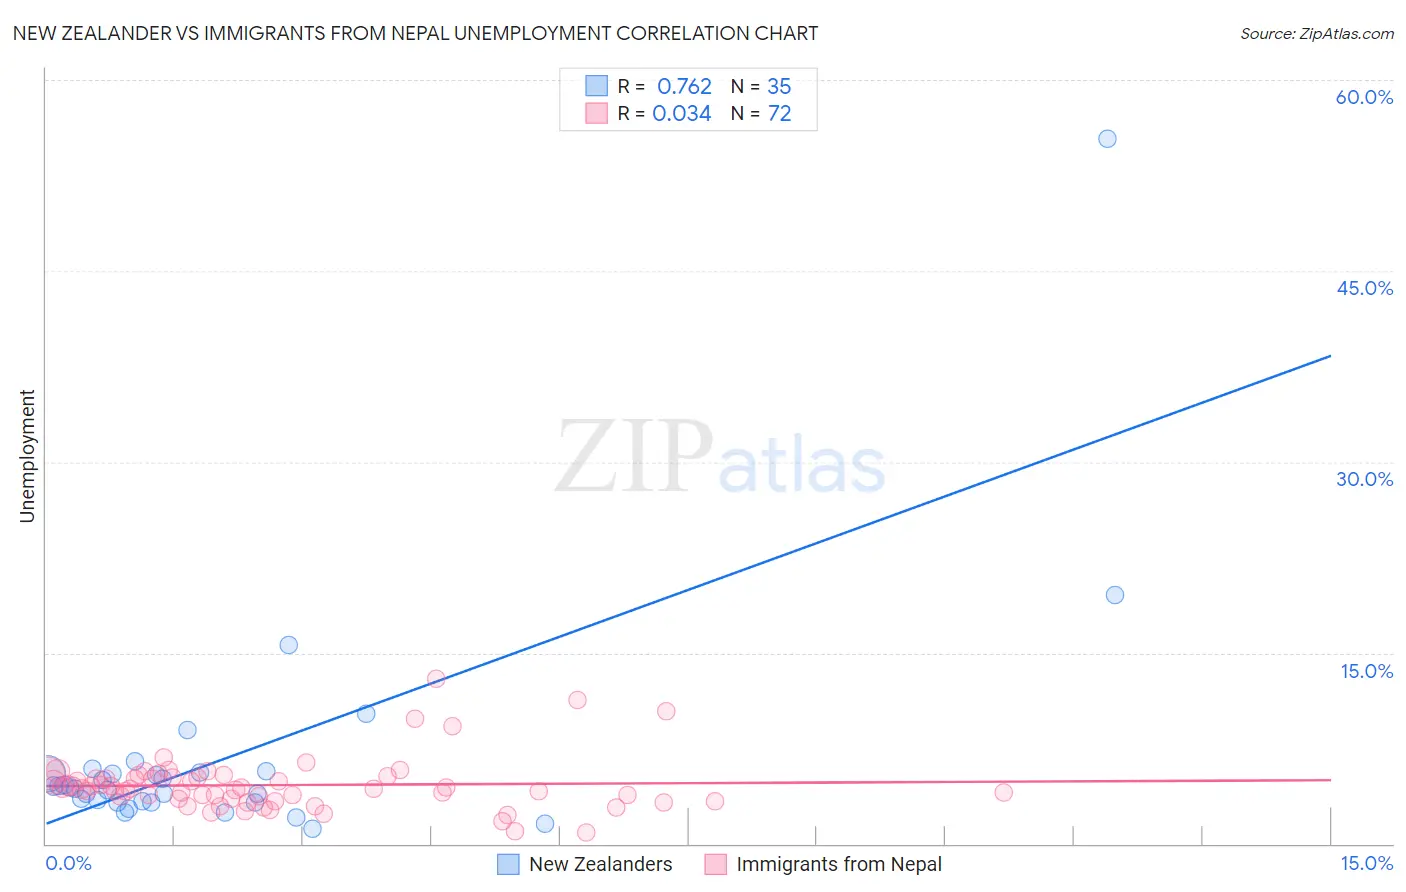
New Zealander vs Immigrants from Nepal Unemployment Correlation Chart
The statistical analysis conducted on geographies consisting of 106,884,587 people shows a strong positive correlation between the proportion of New Zealanders and unemployment in the United States with a correlation coefficient (R) of 0.762 and weighted average of 4.9%. Similarly, the statistical analysis conducted on geographies consisting of 186,724,623 people shows no correlation between the proportion of Immigrants from Nepal and unemployment in the United States with a correlation coefficient (R) of 0.034 and weighted average of 4.8%, a difference of 1.4%.
Unemployment Correlation Summary
| Measurement | New Zealander | Immigrants from Nepal |
| Minimum | 1.2% | 0.90% |
| Maximum | 55.4% | 13.0% |
| Range | 54.2% | 12.1% |
| Mean | 6.6% | 4.6% |
| Median | 4.4% | 4.3% |
| Interquartile 25% (IQ1) | 3.3% | 3.5% |
| Interquartile 75% (IQ3) | 5.6% | 5.2% |
| Interquartile Range (IQR) | 2.3% | 1.6% |
| Standard Deviation (Sample) | 9.2% | 2.1% |
| Standard Deviation (Population) | 9.1% | 2.1% |
Similar Demographics by Unemployment
Demographics Similar to New Zealanders by Unemployment
In terms of unemployment, the demographic groups most similar to New Zealanders are Slavic (4.9%, a difference of 0.030%), Slovak (4.9%, a difference of 0.040%), Immigrants from North America (4.9%, a difference of 0.12%), Immigrants from Canada (4.9%, a difference of 0.19%), and Serbian (4.9%, a difference of 0.27%).
| Demographics | Rating | Rank | Unemployment |
| Immigrants | Netherlands | 99.0 /100 | #60 | Exceptional 4.9% |
| Cambodians | 99.0 /100 | #61 | Exceptional 4.9% |
| Icelanders | 98.9 /100 | #62 | Exceptional 4.9% |
| Immigrants | Bulgaria | 98.9 /100 | #63 | Exceptional 4.9% |
| Italians | 98.9 /100 | #64 | Exceptional 4.9% |
| Immigrants | Canada | 98.8 /100 | #65 | Exceptional 4.9% |
| Slovaks | 98.7 /100 | #66 | Exceptional 4.9% |
| New Zealanders | 98.6 /100 | #67 | Exceptional 4.9% |
| Slavs | 98.6 /100 | #68 | Exceptional 4.9% |
| Immigrants | North America | 98.5 /100 | #69 | Exceptional 4.9% |
| Serbians | 98.4 /100 | #70 | Exceptional 4.9% |
| Immigrants | Japan | 98.3 /100 | #71 | Exceptional 4.9% |
| Burmese | 98.3 /100 | #72 | Exceptional 4.9% |
| Paraguayans | 98.3 /100 | #73 | Exceptional 4.9% |
| Immigrants | Northern Europe | 98.2 /100 | #74 | Exceptional 4.9% |
Demographics Similar to Immigrants from Nepal by Unemployment
In terms of unemployment, the demographic groups most similar to Immigrants from Nepal are Immigrants from Taiwan (4.8%, a difference of 0.020%), French (4.8%, a difference of 0.16%), Austrian (4.8%, a difference of 0.22%), Immigrants from Scotland (4.9%, a difference of 0.23%), and Immigrants from South Central Asia (4.9%, a difference of 0.24%).
| Demographics | Rating | Rank | Unemployment |
| Lithuanians | 99.7 /100 | #39 | Exceptional 4.8% |
| Northern Europeans | 99.7 /100 | #40 | Exceptional 4.8% |
| Immigrants | Bosnia and Herzegovina | 99.7 /100 | #41 | Exceptional 4.8% |
| Filipinos | 99.5 /100 | #42 | Exceptional 4.8% |
| Yugoslavians | 99.5 /100 | #43 | Exceptional 4.8% |
| Austrians | 99.5 /100 | #44 | Exceptional 4.8% |
| French | 99.5 /100 | #45 | Exceptional 4.8% |
| Immigrants | Nepal | 99.4 /100 | #46 | Exceptional 4.8% |
| Immigrants | Taiwan | 99.4 /100 | #47 | Exceptional 4.8% |
| Immigrants | Scotland | 99.3 /100 | #48 | Exceptional 4.9% |
| Immigrants | South Central Asia | 99.3 /100 | #49 | Exceptional 4.9% |
| French Canadians | 99.3 /100 | #50 | Exceptional 4.9% |
| Immigrants | Belgium | 99.2 /100 | #51 | Exceptional 4.9% |
| Whites/Caucasians | 99.2 /100 | #52 | Exceptional 4.9% |
| Immigrants | Zimbabwe | 99.2 /100 | #53 | Exceptional 4.9% |