Chippewa vs Sudanese Unemployment
COMPARE
Chippewa
Sudanese
Unemployment
Unemployment Comparison
Chippewa
Sudanese
6.2%
UNEMPLOYMENT
0.0/ 100
METRIC RATING
289th/ 347
METRIC RANK
4.8%
UNEMPLOYMENT
99.8/ 100
METRIC RATING
33rd/ 347
METRIC RANK
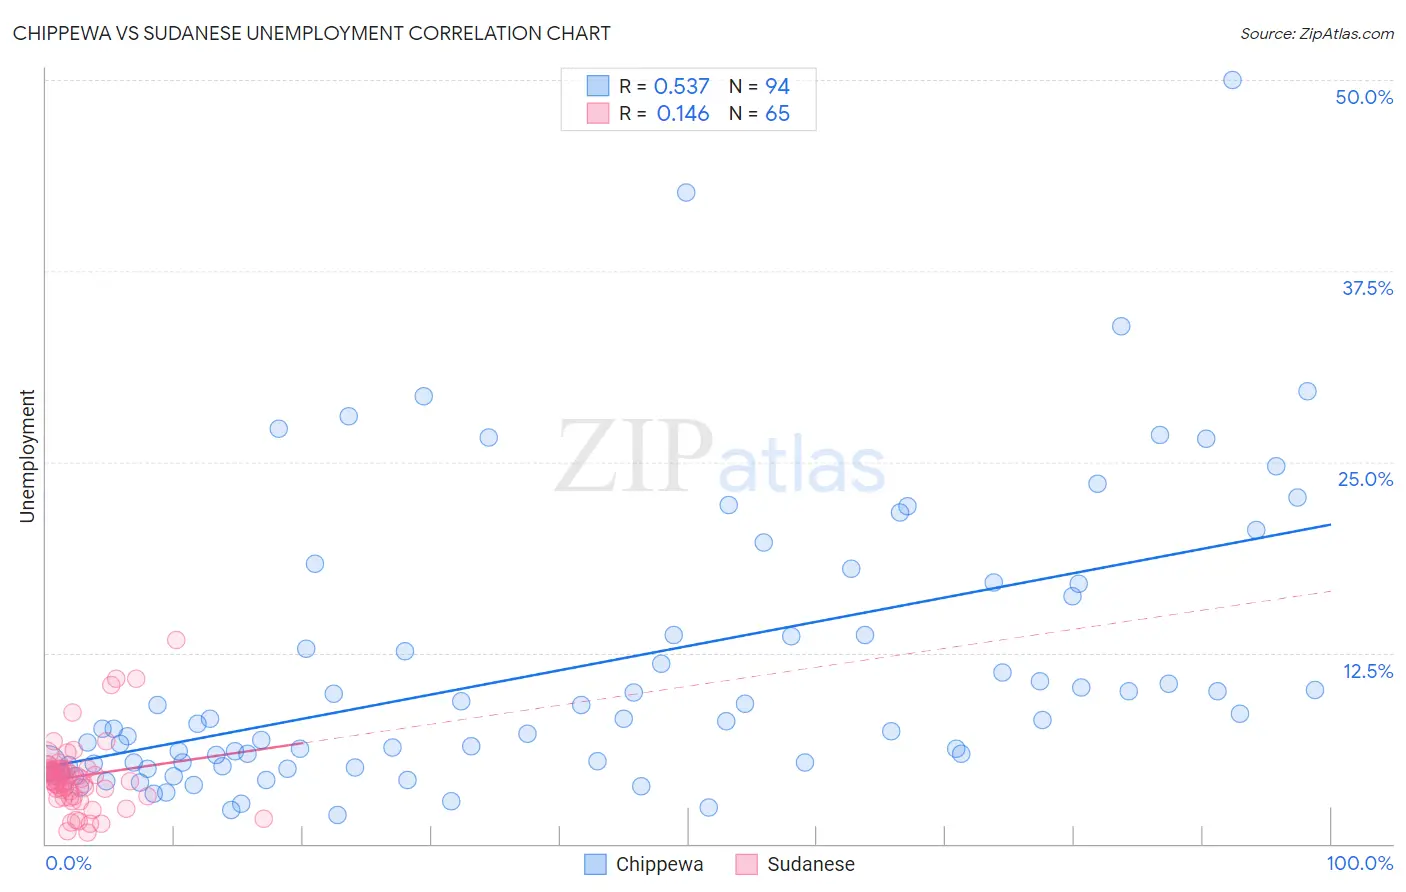
Chippewa vs Sudanese Unemployment Correlation Chart
The statistical analysis conducted on geographies consisting of 214,819,653 people shows a substantial positive correlation between the proportion of Chippewa and unemployment in the United States with a correlation coefficient (R) of 0.537 and weighted average of 6.2%. Similarly, the statistical analysis conducted on geographies consisting of 110,101,890 people shows a poor positive correlation between the proportion of Sudanese and unemployment in the United States with a correlation coefficient (R) of 0.146 and weighted average of 4.8%, a difference of 30.1%.
Unemployment Correlation Summary
| Measurement | Chippewa | Sudanese |
| Minimum | 1.9% | 0.70% |
| Maximum | 50.0% | 13.3% |
| Range | 48.1% | 12.6% |
| Mean | 11.4% | 4.4% |
| Median | 7.9% | 4.2% |
| Interquartile 25% (IQ1) | 5.2% | 3.1% |
| Interquartile 75% (IQ3) | 13.7% | 4.9% |
| Interquartile Range (IQR) | 8.5% | 1.8% |
| Standard Deviation (Sample) | 9.3% | 2.3% |
| Standard Deviation (Population) | 9.2% | 2.3% |
Similar Demographics by Unemployment
Demographics Similar to Chippewa by Unemployment
In terms of unemployment, the demographic groups most similar to Chippewa are Senegalese (6.2%, a difference of 0.090%), Ecuadorian (6.2%, a difference of 0.35%), Nepalese (6.2%, a difference of 0.38%), Haitian (6.2%, a difference of 0.62%), and Central American Indian (6.2%, a difference of 0.64%).
| Demographics | Rating | Rank | Unemployment |
| Immigrants | Azores | 0.0 /100 | #282 | Tragic 6.1% |
| Immigrants | Ghana | 0.0 /100 | #283 | Tragic 6.1% |
| Aleuts | 0.0 /100 | #284 | Tragic 6.1% |
| Immigrants | Senegal | 0.0 /100 | #285 | Tragic 6.1% |
| Immigrants | Caribbean | 0.0 /100 | #286 | Tragic 6.2% |
| Nepalese | 0.0 /100 | #287 | Tragic 6.2% |
| Ecuadorians | 0.0 /100 | #288 | Tragic 6.2% |
| Chippewa | 0.0 /100 | #289 | Tragic 6.2% |
| Senegalese | 0.0 /100 | #290 | Tragic 6.2% |
| Haitians | 0.0 /100 | #291 | Tragic 6.2% |
| Central American Indians | 0.0 /100 | #292 | Tragic 6.2% |
| Immigrants | Ecuador | 0.0 /100 | #293 | Tragic 6.2% |
| Spanish American Indians | 0.0 /100 | #294 | Tragic 6.2% |
| U.S. Virgin Islanders | 0.0 /100 | #295 | Tragic 6.3% |
| Ute | 0.0 /100 | #296 | Tragic 6.3% |
Demographics Similar to Sudanese by Unemployment
In terms of unemployment, the demographic groups most similar to Sudanese are Zimbabwean (4.8%, a difference of 0.010%), Immigrants from Bolivia (4.8%, a difference of 0.040%), Croatian (4.8%, a difference of 0.11%), Scotch-Irish (4.8%, a difference of 0.11%), and Irish (4.8%, a difference of 0.13%).
| Demographics | Rating | Rank | Unemployment |
| Bulgarians | 99.9 /100 | #26 | Exceptional 4.7% |
| Finns | 99.9 /100 | #27 | Exceptional 4.7% |
| Cubans | 99.8 /100 | #28 | Exceptional 4.7% |
| Poles | 99.8 /100 | #29 | Exceptional 4.7% |
| Irish | 99.8 /100 | #30 | Exceptional 4.8% |
| Croatians | 99.8 /100 | #31 | Exceptional 4.8% |
| Zimbabweans | 99.8 /100 | #32 | Exceptional 4.8% |
| Sudanese | 99.8 /100 | #33 | Exceptional 4.8% |
| Immigrants | Bolivia | 99.8 /100 | #34 | Exceptional 4.8% |
| Scotch-Irish | 99.8 /100 | #35 | Exceptional 4.8% |
| Tongans | 99.7 /100 | #36 | Exceptional 4.8% |
| Czechoslovakians | 99.7 /100 | #37 | Exceptional 4.8% |
| Bolivians | 99.7 /100 | #38 | Exceptional 4.8% |
| Lithuanians | 99.7 /100 | #39 | Exceptional 4.8% |
| Northern Europeans | 99.7 /100 | #40 | Exceptional 4.8% |