New Zealander vs Menominee Unemployment
COMPARE
New Zealander
Menominee
Unemployment
Unemployment Comparison
New Zealanders
Menominee
4.9%
UNEMPLOYMENT
98.6/ 100
METRIC RATING
67th/ 347
METRIC RANK
6.4%
UNEMPLOYMENT
0.0/ 100
METRIC RATING
305th/ 347
METRIC RANK
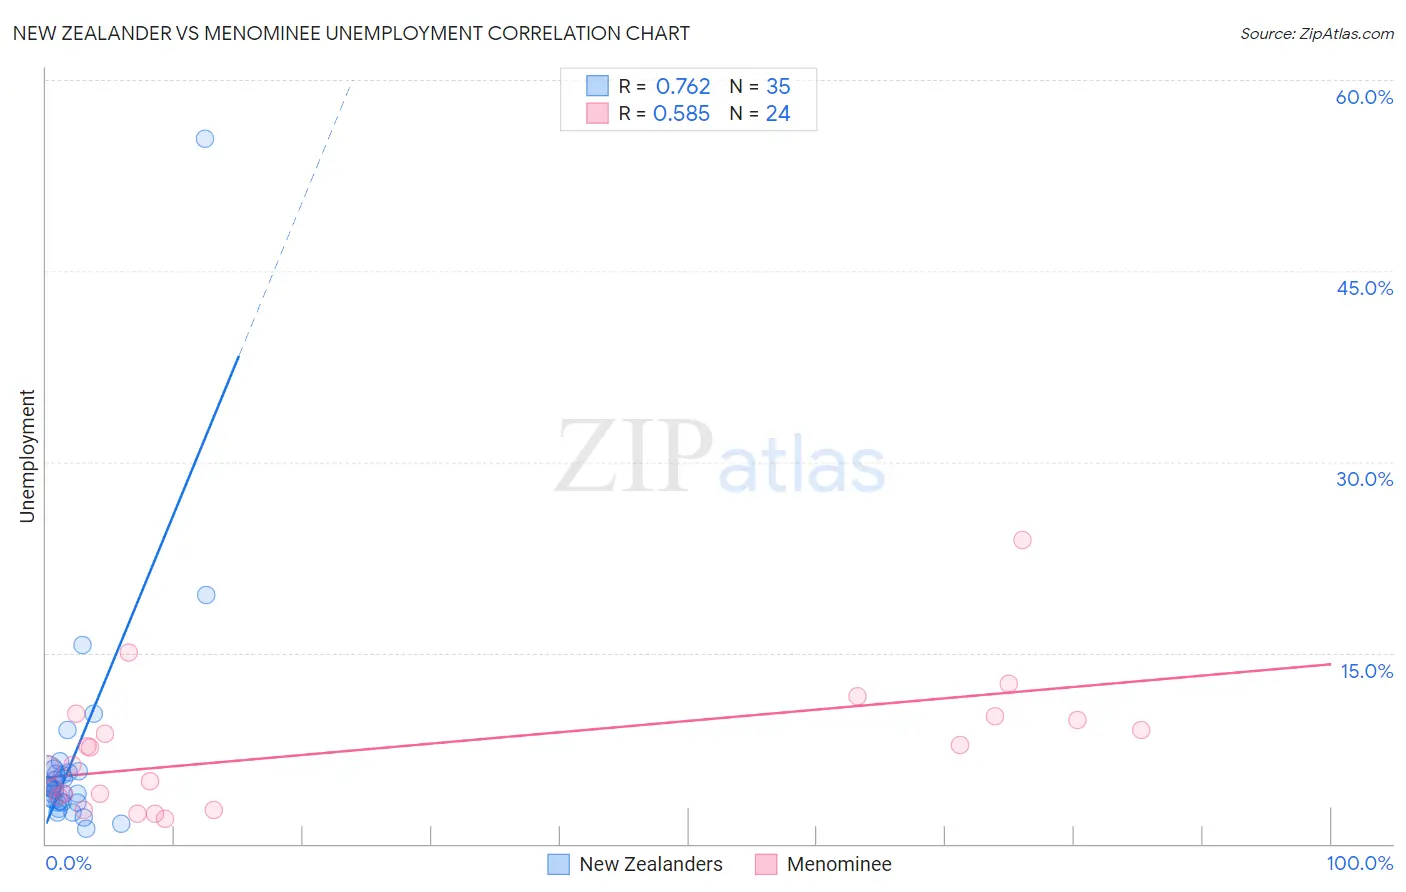
New Zealander vs Menominee Unemployment Correlation Chart
The statistical analysis conducted on geographies consisting of 106,884,587 people shows a strong positive correlation between the proportion of New Zealanders and unemployment in the United States with a correlation coefficient (R) of 0.762 and weighted average of 4.9%. Similarly, the statistical analysis conducted on geographies consisting of 45,752,789 people shows a substantial positive correlation between the proportion of Menominee and unemployment in the United States with a correlation coefficient (R) of 0.585 and weighted average of 6.4%, a difference of 31.0%.
Unemployment Correlation Summary
| Measurement | New Zealander | Menominee |
| Minimum | 1.2% | 2.0% |
| Maximum | 55.4% | 23.9% |
| Range | 54.2% | 21.9% |
| Mean | 6.6% | 7.4% |
| Median | 4.4% | 6.9% |
| Interquartile 25% (IQ1) | 3.3% | 3.8% |
| Interquartile 75% (IQ3) | 5.6% | 9.8% |
| Interquartile Range (IQR) | 2.3% | 6.0% |
| Standard Deviation (Sample) | 9.2% | 5.0% |
| Standard Deviation (Population) | 9.1% | 4.9% |
Similar Demographics by Unemployment
Demographics Similar to New Zealanders by Unemployment
In terms of unemployment, the demographic groups most similar to New Zealanders are Slavic (4.9%, a difference of 0.030%), Slovak (4.9%, a difference of 0.040%), Immigrants from North America (4.9%, a difference of 0.12%), Immigrants from Canada (4.9%, a difference of 0.19%), and Serbian (4.9%, a difference of 0.27%).
| Demographics | Rating | Rank | Unemployment |
| Immigrants | Netherlands | 99.0 /100 | #60 | Exceptional 4.9% |
| Cambodians | 99.0 /100 | #61 | Exceptional 4.9% |
| Icelanders | 98.9 /100 | #62 | Exceptional 4.9% |
| Immigrants | Bulgaria | 98.9 /100 | #63 | Exceptional 4.9% |
| Italians | 98.9 /100 | #64 | Exceptional 4.9% |
| Immigrants | Canada | 98.8 /100 | #65 | Exceptional 4.9% |
| Slovaks | 98.7 /100 | #66 | Exceptional 4.9% |
| New Zealanders | 98.6 /100 | #67 | Exceptional 4.9% |
| Slavs | 98.6 /100 | #68 | Exceptional 4.9% |
| Immigrants | North America | 98.5 /100 | #69 | Exceptional 4.9% |
| Serbians | 98.4 /100 | #70 | Exceptional 4.9% |
| Immigrants | Japan | 98.3 /100 | #71 | Exceptional 4.9% |
| Burmese | 98.3 /100 | #72 | Exceptional 4.9% |
| Paraguayans | 98.3 /100 | #73 | Exceptional 4.9% |
| Immigrants | Northern Europe | 98.2 /100 | #74 | Exceptional 4.9% |
Demographics Similar to Menominee by Unemployment
In terms of unemployment, the demographic groups most similar to Menominee are Lumbee (6.4%, a difference of 0.030%), Immigrants from Jamaica (6.4%, a difference of 0.25%), Immigrants from Bangladesh (6.5%, a difference of 0.52%), Barbadian (6.5%, a difference of 0.89%), and Vietnamese (6.5%, a difference of 0.90%).
| Demographics | Rating | Rank | Unemployment |
| Immigrants | Haiti | 0.0 /100 | #298 | Tragic 6.3% |
| Immigrants | West Indies | 0.0 /100 | #299 | Tragic 6.3% |
| Immigrants | Trinidad and Tobago | 0.0 /100 | #300 | Tragic 6.3% |
| Trinidadians and Tobagonians | 0.0 /100 | #301 | Tragic 6.3% |
| West Indians | 0.0 /100 | #302 | Tragic 6.4% |
| Belizeans | 0.0 /100 | #303 | Tragic 6.4% |
| Immigrants | Jamaica | 0.0 /100 | #304 | Tragic 6.4% |
| Menominee | 0.0 /100 | #305 | Tragic 6.4% |
| Lumbee | 0.0 /100 | #306 | Tragic 6.4% |
| Immigrants | Bangladesh | 0.0 /100 | #307 | Tragic 6.5% |
| Barbadians | 0.0 /100 | #308 | Tragic 6.5% |
| Vietnamese | 0.0 /100 | #309 | Tragic 6.5% |
| Immigrants | Belize | 0.0 /100 | #310 | Tragic 6.5% |
| Cape Verdeans | 0.0 /100 | #311 | Tragic 6.5% |
| Colville | 0.0 /100 | #312 | Tragic 6.6% |