Maltese vs Immigrants from Denmark Unemployment
COMPARE
Maltese
Immigrants from Denmark
Unemployment
Unemployment Comparison
Maltese
Immigrants from Denmark
5.0%
UNEMPLOYMENT
94.0/ 100
METRIC RATING
105th/ 347
METRIC RANK
5.1%
UNEMPLOYMENT
84.3/ 100
METRIC RATING
140th/ 347
METRIC RANK
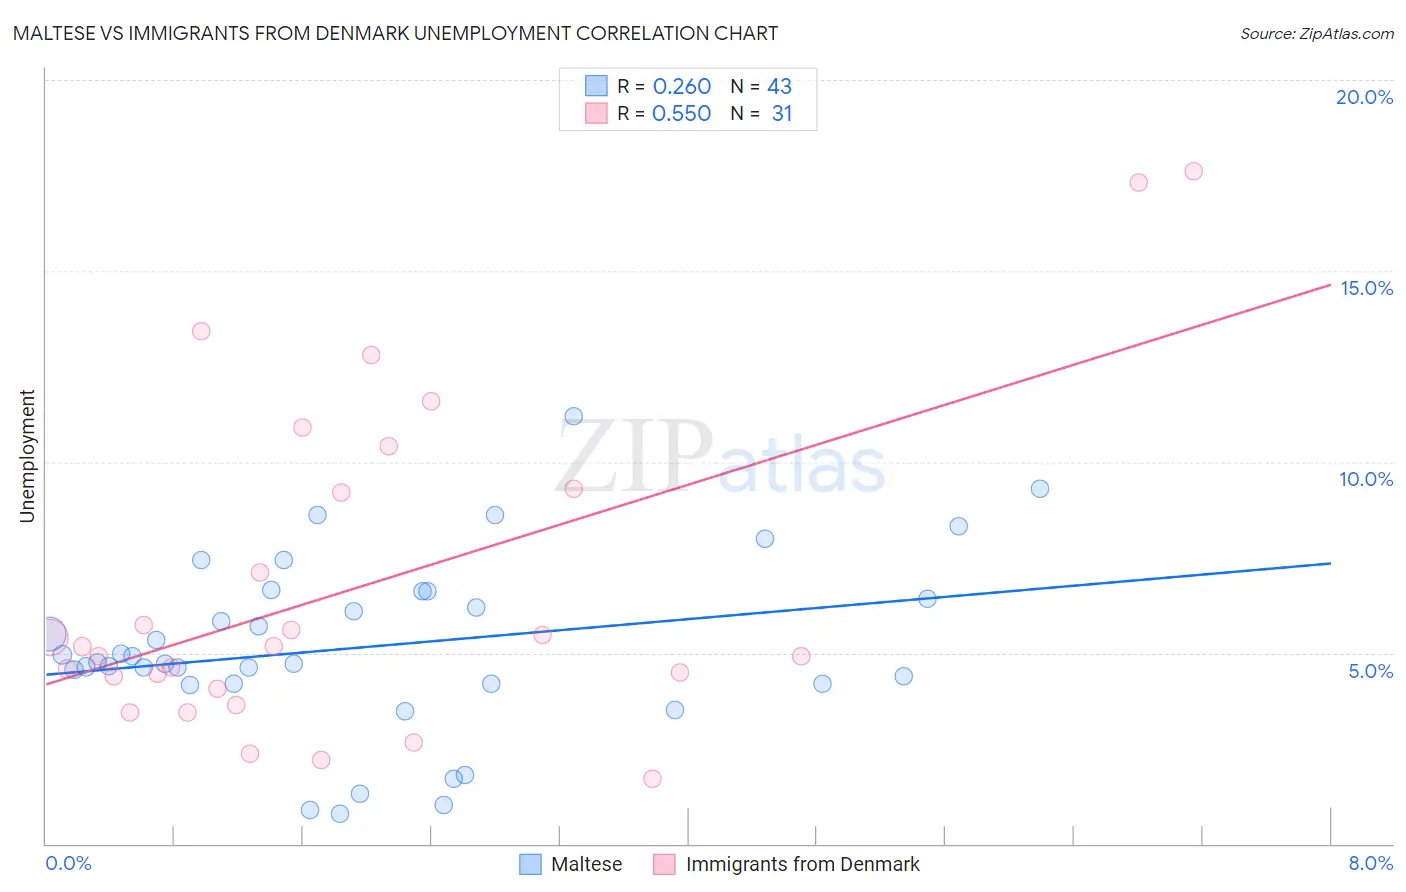
Maltese vs Immigrants from Denmark Unemployment Correlation Chart
The statistical analysis conducted on geographies consisting of 126,436,055 people shows a weak positive correlation between the proportion of Maltese and unemployment in the United States with a correlation coefficient (R) of 0.260 and weighted average of 5.0%. Similarly, the statistical analysis conducted on geographies consisting of 136,363,716 people shows a substantial positive correlation between the proportion of Immigrants from Denmark and unemployment in the United States with a correlation coefficient (R) of 0.550 and weighted average of 5.1%, a difference of 1.7%.
Unemployment Correlation Summary
| Measurement | Maltese | Immigrants from Denmark |
| Minimum | 0.80% | 1.7% |
| Maximum | 11.2% | 17.6% |
| Range | 10.4% | 15.9% |
| Mean | 5.2% | 6.7% |
| Median | 4.7% | 5.2% |
| Interquartile 25% (IQ1) | 4.2% | 4.0% |
| Interquartile 75% (IQ3) | 6.6% | 9.3% |
| Interquartile Range (IQR) | 2.4% | 5.3% |
| Standard Deviation (Sample) | 2.3% | 4.2% |
| Standard Deviation (Population) | 2.3% | 4.2% |
Similar Demographics by Unemployment
Demographics Similar to Maltese by Unemployment
In terms of unemployment, the demographic groups most similar to Maltese are Chickasaw (5.0%, a difference of 0.0%), Osage (5.0%, a difference of 0.0%), Immigrants from Argentina (5.0%, a difference of 0.040%), Immigrants from Romania (5.0%, a difference of 0.070%), and Immigrants from Turkey (5.0%, a difference of 0.080%).
| Demographics | Rating | Rank | Unemployment |
| Romanians | 95.0 /100 | #98 | Exceptional 5.0% |
| Mongolians | 94.8 /100 | #99 | Exceptional 5.0% |
| Estonians | 94.6 /100 | #100 | Exceptional 5.0% |
| Americans | 94.3 /100 | #101 | Exceptional 5.0% |
| Immigrants | Argentina | 94.1 /100 | #102 | Exceptional 5.0% |
| Chickasaw | 94.0 /100 | #103 | Exceptional 5.0% |
| Osage | 94.0 /100 | #104 | Exceptional 5.0% |
| Maltese | 94.0 /100 | #105 | Exceptional 5.0% |
| Immigrants | Romania | 93.7 /100 | #106 | Exceptional 5.0% |
| Immigrants | Turkey | 93.7 /100 | #107 | Exceptional 5.0% |
| Immigrants | Kuwait | 93.7 /100 | #108 | Exceptional 5.0% |
| Immigrants | Eritrea | 93.3 /100 | #109 | Exceptional 5.0% |
| Immigrants | Lithuania | 93.2 /100 | #110 | Exceptional 5.0% |
| Chileans | 93.2 /100 | #111 | Exceptional 5.0% |
| South Africans | 92.6 /100 | #112 | Exceptional 5.1% |
Demographics Similar to Immigrants from Denmark by Unemployment
In terms of unemployment, the demographic groups most similar to Immigrants from Denmark are Palestinian (5.1%, a difference of 0.11%), Immigrants from Pakistan (5.1%, a difference of 0.12%), Pakistani (5.1%, a difference of 0.13%), Immigrants from Hungary (5.1%, a difference of 0.16%), and Immigrants from Saudi Arabia (5.1%, a difference of 0.17%).
| Demographics | Rating | Rank | Unemployment |
| Immigrants | Jordan | 86.6 /100 | #133 | Excellent 5.1% |
| Immigrants | Europe | 86.3 /100 | #134 | Excellent 5.1% |
| Immigrants | Burma/Myanmar | 86.2 /100 | #135 | Excellent 5.1% |
| Immigrants | Spain | 86.2 /100 | #136 | Excellent 5.1% |
| Immigrants | Saudi Arabia | 85.6 /100 | #137 | Excellent 5.1% |
| Immigrants | Hungary | 85.6 /100 | #138 | Excellent 5.1% |
| Pakistanis | 85.3 /100 | #139 | Excellent 5.1% |
| Immigrants | Denmark | 84.3 /100 | #140 | Excellent 5.1% |
| Palestinians | 83.4 /100 | #141 | Excellent 5.1% |
| Immigrants | Pakistan | 83.2 /100 | #142 | Excellent 5.1% |
| Immigrants | Chile | 82.8 /100 | #143 | Excellent 5.1% |
| Indonesians | 82.3 /100 | #144 | Excellent 5.1% |
| Immigrants | Norway | 81.8 /100 | #145 | Excellent 5.1% |
| Immigrants | Asia | 81.8 /100 | #146 | Excellent 5.1% |
| Indians (Asian) | 81.6 /100 | #147 | Excellent 5.1% |