Luxembourger vs Immigrants from North America Unemployment
COMPARE
Luxembourger
Immigrants from North America
Unemployment
Unemployment Comparison
Luxembourgers
Immigrants from North America
4.3%
UNEMPLOYMENT
100.0/ 100
METRIC RATING
2nd/ 347
METRIC RANK
4.9%
UNEMPLOYMENT
98.5/ 100
METRIC RATING
69th/ 347
METRIC RANK
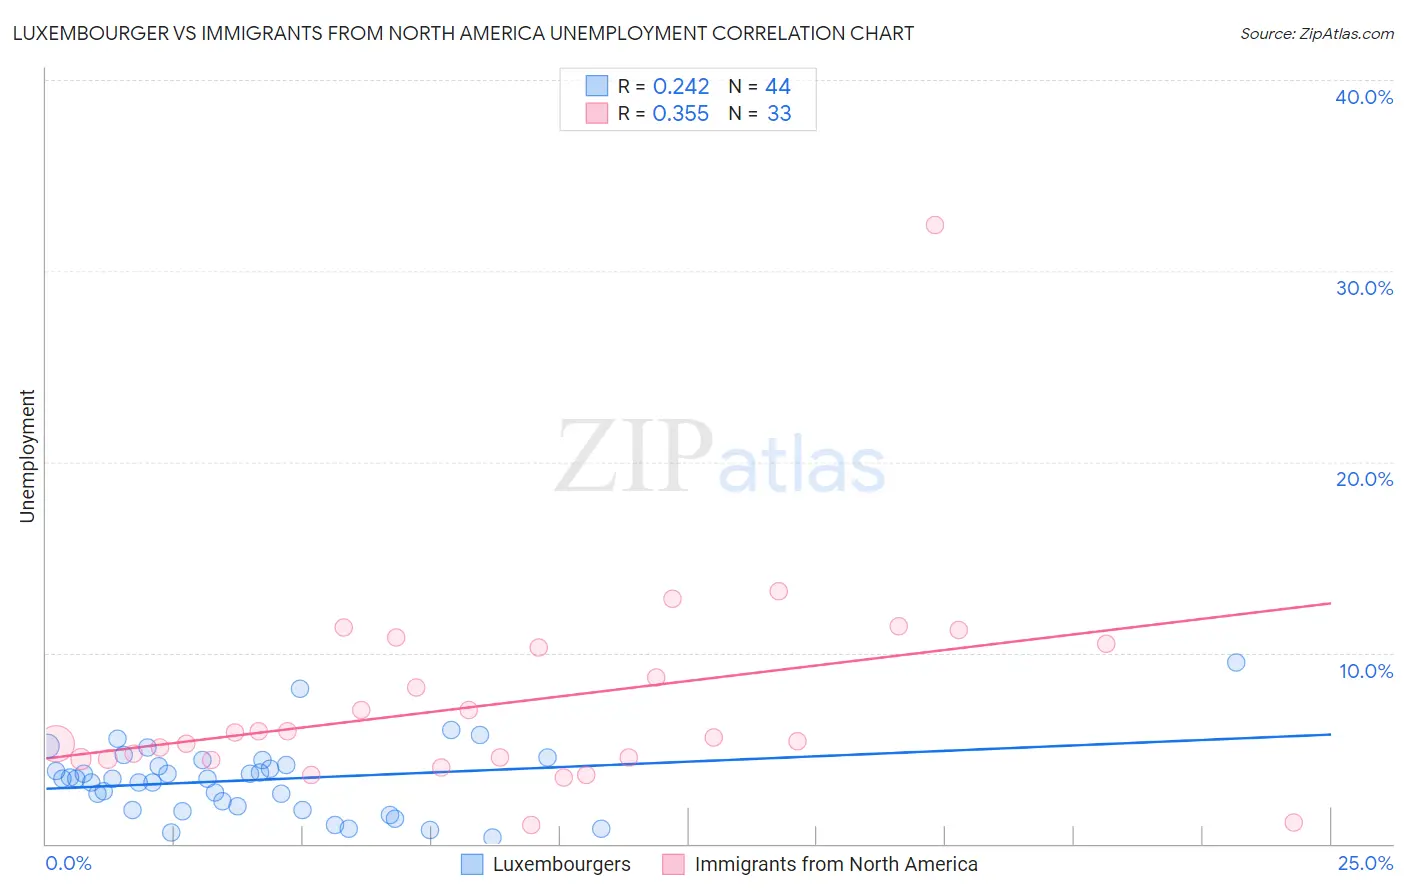
Luxembourger vs Immigrants from North America Unemployment Correlation Chart
The statistical analysis conducted on geographies consisting of 144,557,593 people shows a weak positive correlation between the proportion of Luxembourgers and unemployment in the United States with a correlation coefficient (R) of 0.242 and weighted average of 4.3%. Similarly, the statistical analysis conducted on geographies consisting of 461,564,584 people shows a mild positive correlation between the proportion of Immigrants from North America and unemployment in the United States with a correlation coefficient (R) of 0.355 and weighted average of 4.9%, a difference of 13.4%.
Unemployment Correlation Summary
| Measurement | Luxembourger | Immigrants from North America |
| Minimum | 0.30% | 1.0% |
| Maximum | 9.5% | 32.4% |
| Range | 9.2% | 31.4% |
| Mean | 3.3% | 7.4% |
| Median | 3.4% | 5.6% |
| Interquartile 25% (IQ1) | 1.9% | 4.4% |
| Interquartile 75% (IQ3) | 4.3% | 10.4% |
| Interquartile Range (IQR) | 2.4% | 5.9% |
| Standard Deviation (Sample) | 1.9% | 5.5% |
| Standard Deviation (Population) | 1.9% | 5.5% |
Similar Demographics by Unemployment
Demographics Similar to Luxembourgers by Unemployment
In terms of unemployment, the demographic groups most similar to Luxembourgers are Czech (4.3%, a difference of 0.10%), Danish (4.3%, a difference of 0.25%), Swedish (4.4%, a difference of 2.5%), German (4.5%, a difference of 3.4%), and Norwegian (4.2%, a difference of 3.4%).
| Demographics | Rating | Rank | Unemployment |
| Norwegians | 100.0 /100 | #1 | Exceptional 4.2% |
| Luxembourgers | 100.0 /100 | #2 | Exceptional 4.3% |
| Czechs | 100.0 /100 | #3 | Exceptional 4.3% |
| Danes | 100.0 /100 | #4 | Exceptional 4.3% |
| Swedes | 100.0 /100 | #5 | Exceptional 4.4% |
| Germans | 100.0 /100 | #6 | Exceptional 4.5% |
| Immigrants | India | 100.0 /100 | #7 | Exceptional 4.5% |
| Swiss | 100.0 /100 | #8 | Exceptional 4.5% |
| Scandinavians | 100.0 /100 | #9 | Exceptional 4.5% |
| Dutch | 100.0 /100 | #10 | Exceptional 4.6% |
| English | 100.0 /100 | #11 | Exceptional 4.6% |
| Pennsylvania Germans | 100.0 /100 | #12 | Exceptional 4.6% |
| Belgians | 100.0 /100 | #13 | Exceptional 4.6% |
| Immigrants | Cuba | 100.0 /100 | #14 | Exceptional 4.6% |
| Europeans | 99.9 /100 | #15 | Exceptional 4.6% |
Demographics Similar to Immigrants from North America by Unemployment
In terms of unemployment, the demographic groups most similar to Immigrants from North America are Slavic (4.9%, a difference of 0.090%), New Zealander (4.9%, a difference of 0.12%), Serbian (4.9%, a difference of 0.15%), Slovak (4.9%, a difference of 0.16%), and Immigrants from Japan (4.9%, a difference of 0.21%).
| Demographics | Rating | Rank | Unemployment |
| Icelanders | 98.9 /100 | #62 | Exceptional 4.9% |
| Immigrants | Bulgaria | 98.9 /100 | #63 | Exceptional 4.9% |
| Italians | 98.9 /100 | #64 | Exceptional 4.9% |
| Immigrants | Canada | 98.8 /100 | #65 | Exceptional 4.9% |
| Slovaks | 98.7 /100 | #66 | Exceptional 4.9% |
| New Zealanders | 98.6 /100 | #67 | Exceptional 4.9% |
| Slavs | 98.6 /100 | #68 | Exceptional 4.9% |
| Immigrants | North America | 98.5 /100 | #69 | Exceptional 4.9% |
| Serbians | 98.4 /100 | #70 | Exceptional 4.9% |
| Immigrants | Japan | 98.3 /100 | #71 | Exceptional 4.9% |
| Burmese | 98.3 /100 | #72 | Exceptional 4.9% |
| Paraguayans | 98.3 /100 | #73 | Exceptional 4.9% |
| Immigrants | Northern Europe | 98.2 /100 | #74 | Exceptional 4.9% |
| Turks | 98.0 /100 | #75 | Exceptional 4.9% |
| German Russians | 98.0 /100 | #76 | Exceptional 4.9% |