Luxembourger vs Immigrants from Haiti Unemployment
COMPARE
Luxembourger
Immigrants from Haiti
Unemployment
Unemployment Comparison
Luxembourgers
Immigrants from Haiti
4.3%
UNEMPLOYMENT
100.0/ 100
METRIC RATING
2nd/ 347
METRIC RANK
6.3%
UNEMPLOYMENT
0.0/ 100
METRIC RATING
298th/ 347
METRIC RANK
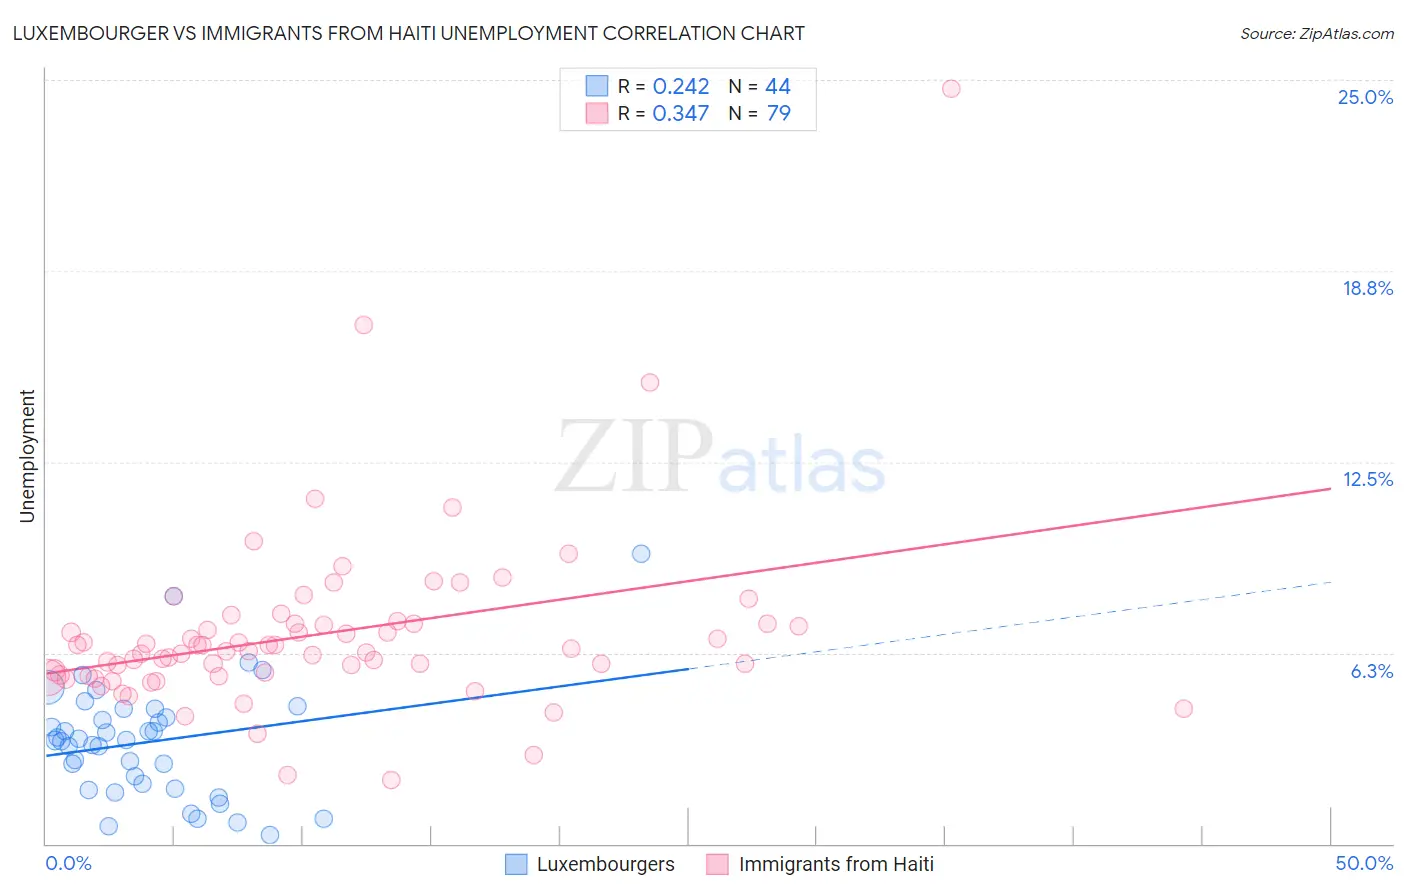
Luxembourger vs Immigrants from Haiti Unemployment Correlation Chart
The statistical analysis conducted on geographies consisting of 144,557,593 people shows a weak positive correlation between the proportion of Luxembourgers and unemployment in the United States with a correlation coefficient (R) of 0.242 and weighted average of 4.3%. Similarly, the statistical analysis conducted on geographies consisting of 225,163,830 people shows a mild positive correlation between the proportion of Immigrants from Haiti and unemployment in the United States with a correlation coefficient (R) of 0.347 and weighted average of 6.3%, a difference of 45.4%.
Unemployment Correlation Summary
| Measurement | Luxembourger | Immigrants from Haiti |
| Minimum | 0.30% | 2.1% |
| Maximum | 9.5% | 24.7% |
| Range | 9.2% | 22.6% |
| Mean | 3.3% | 6.9% |
| Median | 3.4% | 6.3% |
| Interquartile 25% (IQ1) | 1.9% | 5.5% |
| Interquartile 75% (IQ3) | 4.3% | 7.2% |
| Interquartile Range (IQR) | 2.4% | 1.7% |
| Standard Deviation (Sample) | 1.9% | 3.0% |
| Standard Deviation (Population) | 1.9% | 3.0% |
Similar Demographics by Unemployment
Demographics Similar to Luxembourgers by Unemployment
In terms of unemployment, the demographic groups most similar to Luxembourgers are Czech (4.3%, a difference of 0.10%), Danish (4.3%, a difference of 0.25%), Swedish (4.4%, a difference of 2.5%), German (4.5%, a difference of 3.4%), and Norwegian (4.2%, a difference of 3.4%).
| Demographics | Rating | Rank | Unemployment |
| Norwegians | 100.0 /100 | #1 | Exceptional 4.2% |
| Luxembourgers | 100.0 /100 | #2 | Exceptional 4.3% |
| Czechs | 100.0 /100 | #3 | Exceptional 4.3% |
| Danes | 100.0 /100 | #4 | Exceptional 4.3% |
| Swedes | 100.0 /100 | #5 | Exceptional 4.4% |
| Germans | 100.0 /100 | #6 | Exceptional 4.5% |
| Immigrants | India | 100.0 /100 | #7 | Exceptional 4.5% |
| Swiss | 100.0 /100 | #8 | Exceptional 4.5% |
| Scandinavians | 100.0 /100 | #9 | Exceptional 4.5% |
| Dutch | 100.0 /100 | #10 | Exceptional 4.6% |
| English | 100.0 /100 | #11 | Exceptional 4.6% |
| Pennsylvania Germans | 100.0 /100 | #12 | Exceptional 4.6% |
| Belgians | 100.0 /100 | #13 | Exceptional 4.6% |
| Immigrants | Cuba | 100.0 /100 | #14 | Exceptional 4.6% |
| Europeans | 99.9 /100 | #15 | Exceptional 4.6% |
Demographics Similar to Immigrants from Haiti by Unemployment
In terms of unemployment, the demographic groups most similar to Immigrants from Haiti are Immigrants from West Indies (6.3%, a difference of 0.050%), Jamaican (6.3%, a difference of 0.090%), Immigrants from Trinidad and Tobago (6.3%, a difference of 0.17%), Ute (6.3%, a difference of 0.43%), and Trinidadian and Tobagonian (6.3%, a difference of 0.65%).
| Demographics | Rating | Rank | Unemployment |
| Haitians | 0.0 /100 | #291 | Tragic 6.2% |
| Central American Indians | 0.0 /100 | #292 | Tragic 6.2% |
| Immigrants | Ecuador | 0.0 /100 | #293 | Tragic 6.2% |
| Spanish American Indians | 0.0 /100 | #294 | Tragic 6.2% |
| U.S. Virgin Islanders | 0.0 /100 | #295 | Tragic 6.3% |
| Ute | 0.0 /100 | #296 | Tragic 6.3% |
| Jamaicans | 0.0 /100 | #297 | Tragic 6.3% |
| Immigrants | Haiti | 0.0 /100 | #298 | Tragic 6.3% |
| Immigrants | West Indies | 0.0 /100 | #299 | Tragic 6.3% |
| Immigrants | Trinidad and Tobago | 0.0 /100 | #300 | Tragic 6.3% |
| Trinidadians and Tobagonians | 0.0 /100 | #301 | Tragic 6.3% |
| West Indians | 0.0 /100 | #302 | Tragic 6.4% |
| Belizeans | 0.0 /100 | #303 | Tragic 6.4% |
| Immigrants | Jamaica | 0.0 /100 | #304 | Tragic 6.4% |
| Menominee | 0.0 /100 | #305 | Tragic 6.4% |