Luxembourger vs Cuban Unemployment
COMPARE
Luxembourger
Cuban
Unemployment
Unemployment Comparison
Luxembourgers
Cubans
4.3%
UNEMPLOYMENT
100.0/ 100
METRIC RATING
2nd/ 347
METRIC RANK
4.7%
UNEMPLOYMENT
99.8/ 100
METRIC RATING
28th/ 347
METRIC RANK
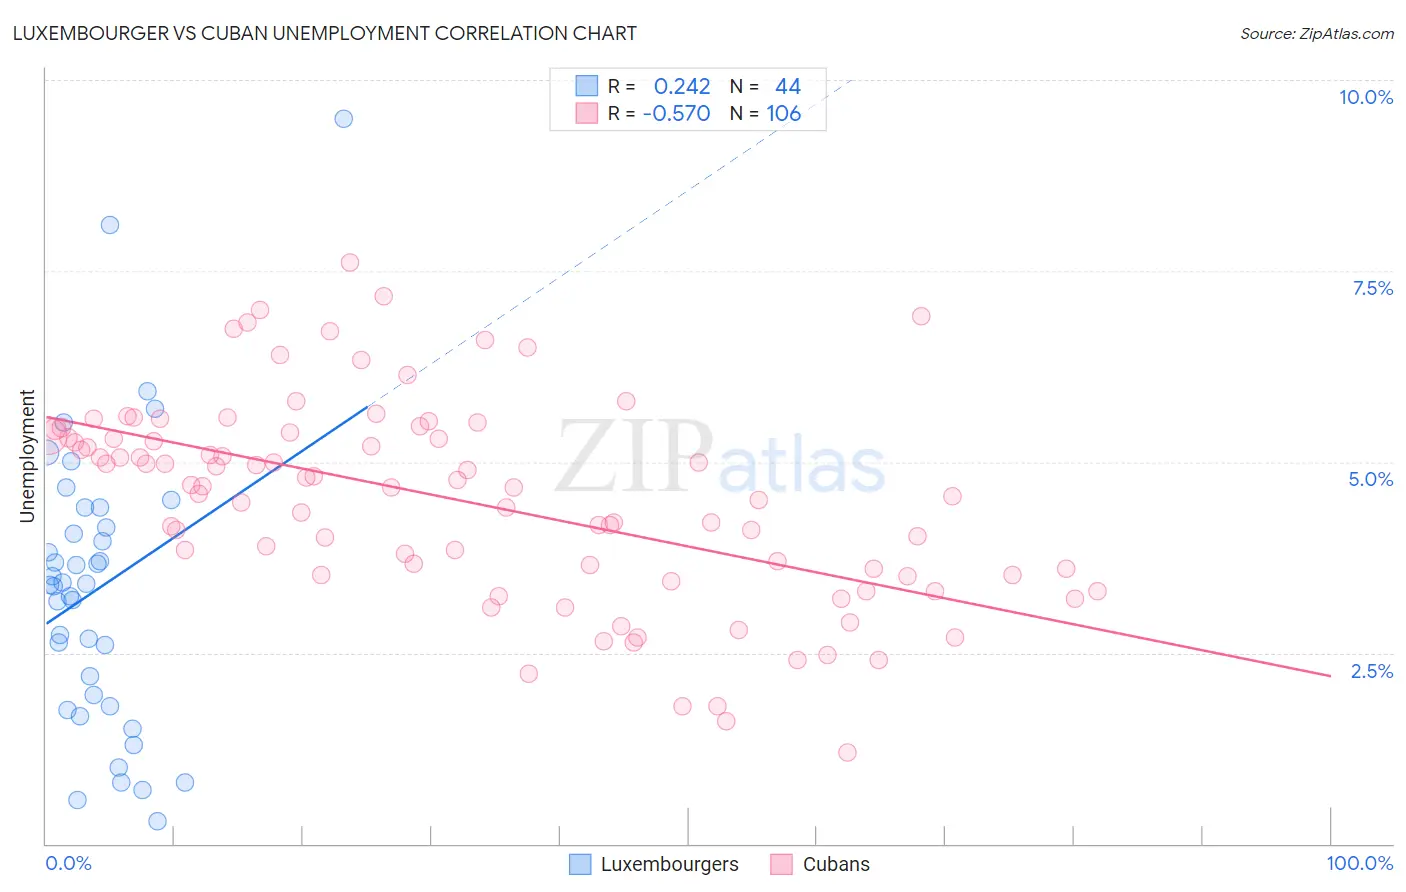
Luxembourger vs Cuban Unemployment Correlation Chart
The statistical analysis conducted on geographies consisting of 144,557,593 people shows a weak positive correlation between the proportion of Luxembourgers and unemployment in the United States with a correlation coefficient (R) of 0.242 and weighted average of 4.3%. Similarly, the statistical analysis conducted on geographies consisting of 448,752,139 people shows a substantial negative correlation between the proportion of Cubans and unemployment in the United States with a correlation coefficient (R) of -0.570 and weighted average of 4.7%, a difference of 9.2%.
Unemployment Correlation Summary
| Measurement | Luxembourger | Cuban |
| Minimum | 0.30% | 1.2% |
| Maximum | 9.5% | 7.6% |
| Range | 9.2% | 6.4% |
| Mean | 3.3% | 4.5% |
| Median | 3.4% | 4.7% |
| Interquartile 25% (IQ1) | 1.9% | 3.5% |
| Interquartile 75% (IQ3) | 4.3% | 5.3% |
| Interquartile Range (IQR) | 2.4% | 1.8% |
| Standard Deviation (Sample) | 1.9% | 1.3% |
| Standard Deviation (Population) | 1.9% | 1.3% |
Similar Demographics by Unemployment
Demographics Similar to Luxembourgers by Unemployment
In terms of unemployment, the demographic groups most similar to Luxembourgers are Czech (4.3%, a difference of 0.10%), Danish (4.3%, a difference of 0.25%), Swedish (4.4%, a difference of 2.5%), German (4.5%, a difference of 3.4%), and Norwegian (4.2%, a difference of 3.4%).
| Demographics | Rating | Rank | Unemployment |
| Norwegians | 100.0 /100 | #1 | Exceptional 4.2% |
| Luxembourgers | 100.0 /100 | #2 | Exceptional 4.3% |
| Czechs | 100.0 /100 | #3 | Exceptional 4.3% |
| Danes | 100.0 /100 | #4 | Exceptional 4.3% |
| Swedes | 100.0 /100 | #5 | Exceptional 4.4% |
| Germans | 100.0 /100 | #6 | Exceptional 4.5% |
| Immigrants | India | 100.0 /100 | #7 | Exceptional 4.5% |
| Swiss | 100.0 /100 | #8 | Exceptional 4.5% |
| Scandinavians | 100.0 /100 | #9 | Exceptional 4.5% |
| Dutch | 100.0 /100 | #10 | Exceptional 4.6% |
| English | 100.0 /100 | #11 | Exceptional 4.6% |
| Pennsylvania Germans | 100.0 /100 | #12 | Exceptional 4.6% |
| Belgians | 100.0 /100 | #13 | Exceptional 4.6% |
| Immigrants | Cuba | 100.0 /100 | #14 | Exceptional 4.6% |
| Europeans | 99.9 /100 | #15 | Exceptional 4.6% |
Demographics Similar to Cubans by Unemployment
In terms of unemployment, the demographic groups most similar to Cubans are Polish (4.7%, a difference of 0.12%), Finnish (4.7%, a difference of 0.32%), Irish (4.8%, a difference of 0.36%), Croatian (4.8%, a difference of 0.38%), and Zimbabwean (4.8%, a difference of 0.48%).
| Demographics | Rating | Rank | Unemployment |
| Welsh | 99.9 /100 | #21 | Exceptional 4.7% |
| Thais | 99.9 /100 | #22 | Exceptional 4.7% |
| British | 99.9 /100 | #23 | Exceptional 4.7% |
| Venezuelans | 99.9 /100 | #24 | Exceptional 4.7% |
| Latvians | 99.9 /100 | #25 | Exceptional 4.7% |
| Bulgarians | 99.9 /100 | #26 | Exceptional 4.7% |
| Finns | 99.9 /100 | #27 | Exceptional 4.7% |
| Cubans | 99.8 /100 | #28 | Exceptional 4.7% |
| Poles | 99.8 /100 | #29 | Exceptional 4.7% |
| Irish | 99.8 /100 | #30 | Exceptional 4.8% |
| Croatians | 99.8 /100 | #31 | Exceptional 4.8% |
| Zimbabweans | 99.8 /100 | #32 | Exceptional 4.8% |
| Sudanese | 99.8 /100 | #33 | Exceptional 4.8% |
| Immigrants | Bolivia | 99.8 /100 | #34 | Exceptional 4.8% |
| Scotch-Irish | 99.8 /100 | #35 | Exceptional 4.8% |