Luxembourger vs Immigrants from Austria Unemployment
COMPARE
Luxembourger
Immigrants from Austria
Unemployment
Unemployment Comparison
Luxembourgers
Immigrants from Austria
4.3%
UNEMPLOYMENT
100.0/ 100
METRIC RATING
2nd/ 347
METRIC RANK
5.0%
UNEMPLOYMENT
95.9/ 100
METRIC RATING
94th/ 347
METRIC RANK
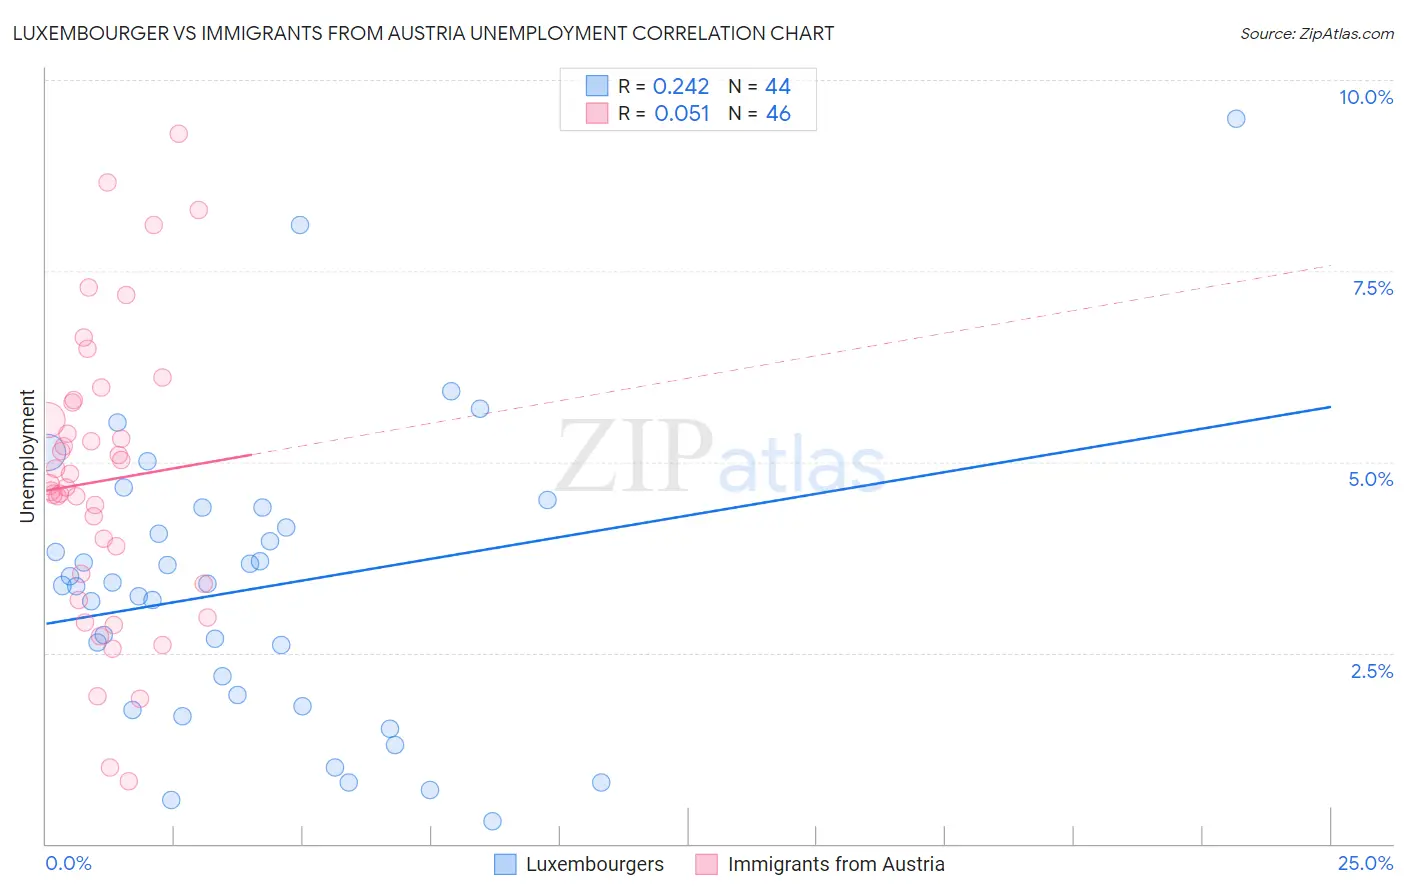
Luxembourger vs Immigrants from Austria Unemployment Correlation Chart
The statistical analysis conducted on geographies consisting of 144,557,593 people shows a weak positive correlation between the proportion of Luxembourgers and unemployment in the United States with a correlation coefficient (R) of 0.242 and weighted average of 4.3%. Similarly, the statistical analysis conducted on geographies consisting of 167,916,125 people shows a slight positive correlation between the proportion of Immigrants from Austria and unemployment in the United States with a correlation coefficient (R) of 0.051 and weighted average of 5.0%, a difference of 15.3%.
Unemployment Correlation Summary
| Measurement | Luxembourger | Immigrants from Austria |
| Minimum | 0.30% | 0.82% |
| Maximum | 9.5% | 9.3% |
| Range | 9.2% | 8.5% |
| Mean | 3.3% | 4.8% |
| Median | 3.4% | 4.7% |
| Interquartile 25% (IQ1) | 1.9% | 3.4% |
| Interquartile 75% (IQ3) | 4.3% | 5.8% |
| Interquartile Range (IQR) | 2.4% | 2.4% |
| Standard Deviation (Sample) | 1.9% | 1.9% |
| Standard Deviation (Population) | 1.9% | 1.9% |
Similar Demographics by Unemployment
Demographics Similar to Luxembourgers by Unemployment
In terms of unemployment, the demographic groups most similar to Luxembourgers are Czech (4.3%, a difference of 0.10%), Danish (4.3%, a difference of 0.25%), Swedish (4.4%, a difference of 2.5%), German (4.5%, a difference of 3.4%), and Norwegian (4.2%, a difference of 3.4%).
| Demographics | Rating | Rank | Unemployment |
| Norwegians | 100.0 /100 | #1 | Exceptional 4.2% |
| Luxembourgers | 100.0 /100 | #2 | Exceptional 4.3% |
| Czechs | 100.0 /100 | #3 | Exceptional 4.3% |
| Danes | 100.0 /100 | #4 | Exceptional 4.3% |
| Swedes | 100.0 /100 | #5 | Exceptional 4.4% |
| Germans | 100.0 /100 | #6 | Exceptional 4.5% |
| Immigrants | India | 100.0 /100 | #7 | Exceptional 4.5% |
| Swiss | 100.0 /100 | #8 | Exceptional 4.5% |
| Scandinavians | 100.0 /100 | #9 | Exceptional 4.5% |
| Dutch | 100.0 /100 | #10 | Exceptional 4.6% |
| English | 100.0 /100 | #11 | Exceptional 4.6% |
| Pennsylvania Germans | 100.0 /100 | #12 | Exceptional 4.6% |
| Belgians | 100.0 /100 | #13 | Exceptional 4.6% |
| Immigrants | Cuba | 100.0 /100 | #14 | Exceptional 4.6% |
| Europeans | 99.9 /100 | #15 | Exceptional 4.6% |
Demographics Similar to Immigrants from Austria by Unemployment
In terms of unemployment, the demographic groups most similar to Immigrants from Austria are Ukrainian (5.0%, a difference of 0.030%), Immigrants from South Africa (5.0%, a difference of 0.12%), Immigrants from Serbia (5.0%, a difference of 0.13%), Immigrants from Sudan (5.0%, a difference of 0.14%), and Immigrants from North Macedonia (5.0%, a difference of 0.16%).
| Demographics | Rating | Rank | Unemployment |
| Immigrants | Moldova | 96.6 /100 | #87 | Exceptional 5.0% |
| Immigrants | Korea | 96.6 /100 | #88 | Exceptional 5.0% |
| Jordanians | 96.4 /100 | #89 | Exceptional 5.0% |
| Immigrants | North Macedonia | 96.3 /100 | #90 | Exceptional 5.0% |
| Immigrants | Sudan | 96.3 /100 | #91 | Exceptional 5.0% |
| Immigrants | South Africa | 96.2 /100 | #92 | Exceptional 5.0% |
| Ukrainians | 96.0 /100 | #93 | Exceptional 5.0% |
| Immigrants | Austria | 95.9 /100 | #94 | Exceptional 5.0% |
| Immigrants | Serbia | 95.6 /100 | #95 | Exceptional 5.0% |
| Immigrants | England | 95.2 /100 | #96 | Exceptional 5.0% |
| Immigrants | Czechoslovakia | 95.1 /100 | #97 | Exceptional 5.0% |
| Romanians | 95.0 /100 | #98 | Exceptional 5.0% |
| Mongolians | 94.8 /100 | #99 | Exceptional 5.0% |
| Estonians | 94.6 /100 | #100 | Exceptional 5.0% |
| Americans | 94.3 /100 | #101 | Exceptional 5.0% |