Bhutanese vs Immigrants from Denmark Unemployment
COMPARE
Bhutanese
Immigrants from Denmark
Unemployment
Unemployment Comparison
Bhutanese
Immigrants from Denmark
4.9%
UNEMPLOYMENT
99.0/ 100
METRIC RATING
59th/ 347
METRIC RANK
5.1%
UNEMPLOYMENT
84.3/ 100
METRIC RATING
140th/ 347
METRIC RANK
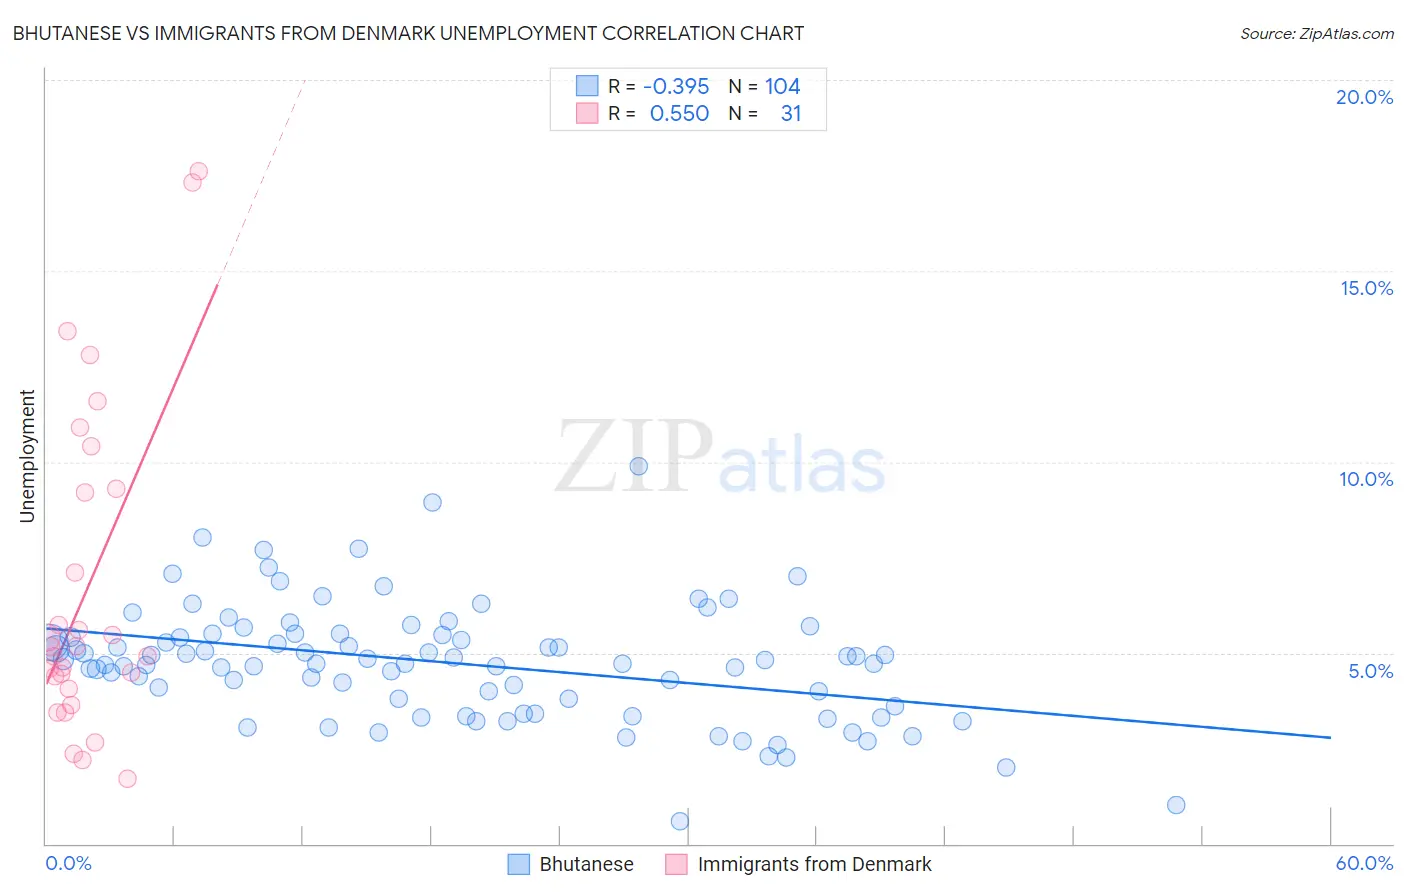
Bhutanese vs Immigrants from Denmark Unemployment Correlation Chart
The statistical analysis conducted on geographies consisting of 454,875,452 people shows a mild negative correlation between the proportion of Bhutanese and unemployment in the United States with a correlation coefficient (R) of -0.395 and weighted average of 4.9%. Similarly, the statistical analysis conducted on geographies consisting of 136,363,716 people shows a substantial positive correlation between the proportion of Immigrants from Denmark and unemployment in the United States with a correlation coefficient (R) of 0.550 and weighted average of 5.1%, a difference of 4.8%.
Unemployment Correlation Summary
| Measurement | Bhutanese | Immigrants from Denmark |
| Minimum | 0.60% | 1.7% |
| Maximum | 9.9% | 17.6% |
| Range | 9.3% | 15.9% |
| Mean | 4.7% | 6.7% |
| Median | 4.8% | 5.2% |
| Interquartile 25% (IQ1) | 3.7% | 4.0% |
| Interquartile 75% (IQ3) | 5.5% | 9.3% |
| Interquartile Range (IQR) | 1.8% | 5.3% |
| Standard Deviation (Sample) | 1.5% | 4.2% |
| Standard Deviation (Population) | 1.5% | 4.2% |
Similar Demographics by Unemployment
Demographics Similar to Bhutanese by Unemployment
In terms of unemployment, the demographic groups most similar to Bhutanese are Greek (4.9%, a difference of 0.030%), Immigrants from Netherlands (4.9%, a difference of 0.050%), Cambodian (4.9%, a difference of 0.050%), Icelander (4.9%, a difference of 0.060%), and Immigrants from Bulgaria (4.9%, a difference of 0.070%).
| Demographics | Rating | Rank | Unemployment |
| Whites/Caucasians | 99.2 /100 | #52 | Exceptional 4.9% |
| Immigrants | Zimbabwe | 99.2 /100 | #53 | Exceptional 4.9% |
| Eastern Europeans | 99.2 /100 | #54 | Exceptional 4.9% |
| Australians | 99.2 /100 | #55 | Exceptional 4.9% |
| Celtics | 99.1 /100 | #56 | Exceptional 4.9% |
| Immigrants | Singapore | 99.1 /100 | #57 | Exceptional 4.9% |
| Greeks | 99.0 /100 | #58 | Exceptional 4.9% |
| Bhutanese | 99.0 /100 | #59 | Exceptional 4.9% |
| Immigrants | Netherlands | 99.0 /100 | #60 | Exceptional 4.9% |
| Cambodians | 99.0 /100 | #61 | Exceptional 4.9% |
| Icelanders | 98.9 /100 | #62 | Exceptional 4.9% |
| Immigrants | Bulgaria | 98.9 /100 | #63 | Exceptional 4.9% |
| Italians | 98.9 /100 | #64 | Exceptional 4.9% |
| Immigrants | Canada | 98.8 /100 | #65 | Exceptional 4.9% |
| Slovaks | 98.7 /100 | #66 | Exceptional 4.9% |
Demographics Similar to Immigrants from Denmark by Unemployment
In terms of unemployment, the demographic groups most similar to Immigrants from Denmark are Palestinian (5.1%, a difference of 0.11%), Immigrants from Pakistan (5.1%, a difference of 0.12%), Pakistani (5.1%, a difference of 0.13%), Immigrants from Hungary (5.1%, a difference of 0.16%), and Immigrants from Saudi Arabia (5.1%, a difference of 0.17%).
| Demographics | Rating | Rank | Unemployment |
| Immigrants | Jordan | 86.6 /100 | #133 | Excellent 5.1% |
| Immigrants | Europe | 86.3 /100 | #134 | Excellent 5.1% |
| Immigrants | Burma/Myanmar | 86.2 /100 | #135 | Excellent 5.1% |
| Immigrants | Spain | 86.2 /100 | #136 | Excellent 5.1% |
| Immigrants | Saudi Arabia | 85.6 /100 | #137 | Excellent 5.1% |
| Immigrants | Hungary | 85.6 /100 | #138 | Excellent 5.1% |
| Pakistanis | 85.3 /100 | #139 | Excellent 5.1% |
| Immigrants | Denmark | 84.3 /100 | #140 | Excellent 5.1% |
| Palestinians | 83.4 /100 | #141 | Excellent 5.1% |
| Immigrants | Pakistan | 83.2 /100 | #142 | Excellent 5.1% |
| Immigrants | Chile | 82.8 /100 | #143 | Excellent 5.1% |
| Indonesians | 82.3 /100 | #144 | Excellent 5.1% |
| Immigrants | Norway | 81.8 /100 | #145 | Excellent 5.1% |
| Immigrants | Asia | 81.8 /100 | #146 | Excellent 5.1% |
| Indians (Asian) | 81.6 /100 | #147 | Excellent 5.1% |