Luxembourger vs Apache Unemployment Among Women with Children Under 6 years
COMPARE
Luxembourger
Apache
Unemployment Among Women with Children Under 6 years
Unemployment Among Women with Children Under 6 years Comparison
Luxembourgers
Apache
6.6%
UNEMPLOYMENT AMONG WOMEN WITH CHILDREN UNDER 6 YEARS
100.0/ 100
METRIC RATING
36th/ 347
METRIC RANK
12.3%
UNEMPLOYMENT AMONG WOMEN WITH CHILDREN UNDER 6 YEARS
0.0/ 100
METRIC RATING
334th/ 347
METRIC RANK
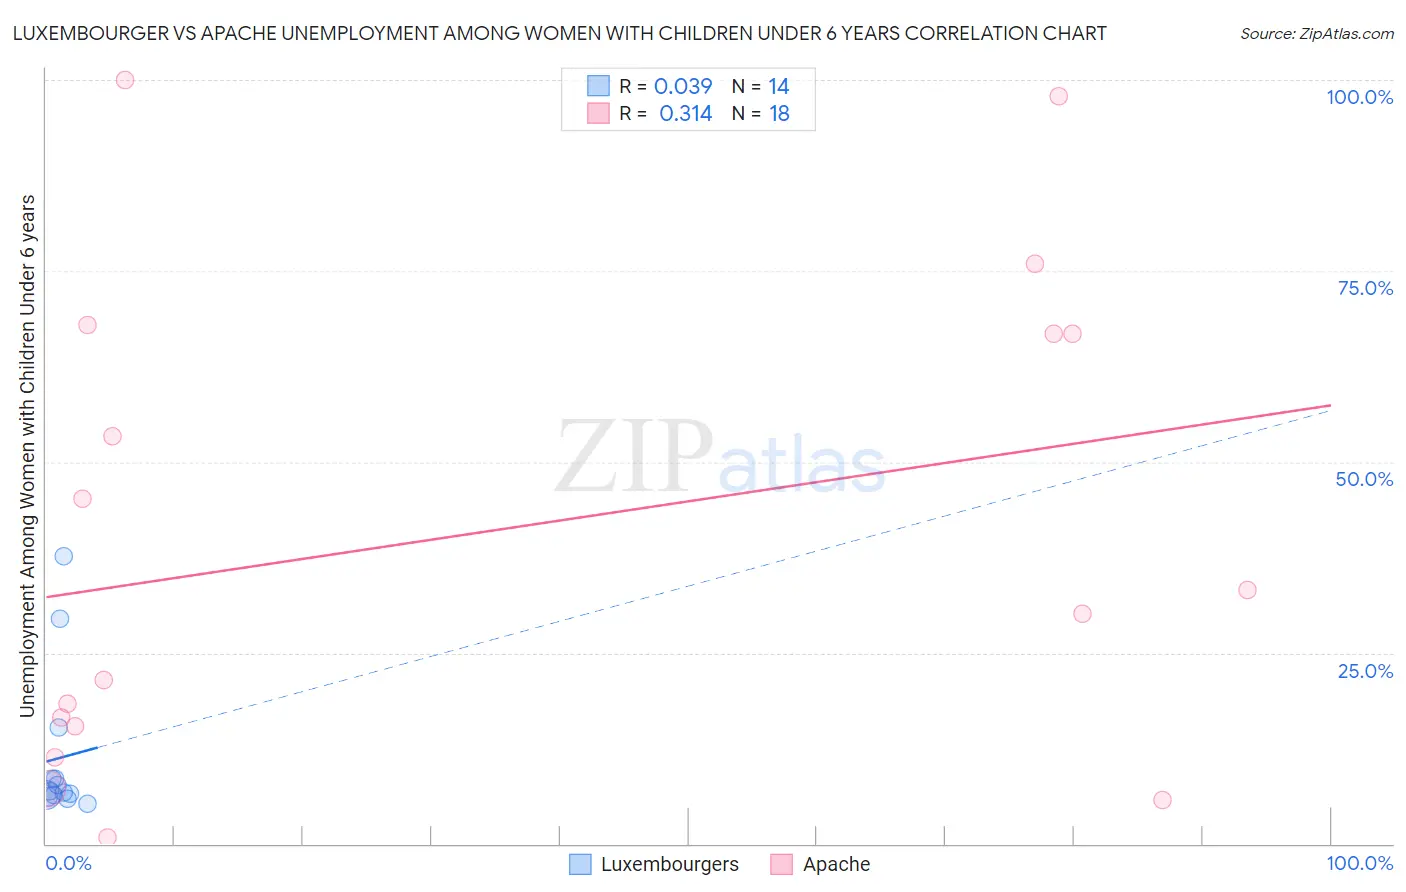
Luxembourger vs Apache Unemployment Among Women with Children Under 6 years Correlation Chart
The statistical analysis conducted on geographies consisting of 119,873,666 people shows no correlation between the proportion of Luxembourgers and unemployment rate among women with children under the age of 6 in the United States with a correlation coefficient (R) of 0.039 and weighted average of 6.6%. Similarly, the statistical analysis conducted on geographies consisting of 192,370,998 people shows a mild positive correlation between the proportion of Apache and unemployment rate among women with children under the age of 6 in the United States with a correlation coefficient (R) of 0.314 and weighted average of 12.3%, a difference of 85.8%.
Unemployment Among Women with Children Under 6 years Correlation Summary
| Measurement | Luxembourger | Apache |
| Minimum | 5.3% | 0.90% |
| Maximum | 37.6% | 100.0% |
| Range | 32.3% | 99.1% |
| Mean | 11.2% | 40.8% |
| Median | 6.8% | 31.7% |
| Interquartile 25% (IQ1) | 6.4% | 15.3% |
| Interquartile 75% (IQ3) | 8.6% | 66.7% |
| Interquartile Range (IQR) | 2.2% | 51.4% |
| Standard Deviation (Sample) | 9.9% | 31.9% |
| Standard Deviation (Population) | 9.5% | 31.0% |
Similar Demographics by Unemployment Among Women with Children Under 6 years
Demographics Similar to Luxembourgers by Unemployment Among Women with Children Under 6 years
In terms of unemployment among women with children under 6 years, the demographic groups most similar to Luxembourgers are Yakama (6.6%, a difference of 0.070%), Sri Lankan (6.6%, a difference of 0.25%), Immigrants from Vietnam (6.6%, a difference of 0.34%), Immigrants from South Central Asia (6.6%, a difference of 0.34%), and Tsimshian (6.6%, a difference of 0.36%).
| Demographics | Rating | Rank | Unemployment Among Women with Children Under 6 years |
| Immigrants | Sweden | 100.0 /100 | #29 | Exceptional 6.6% |
| Immigrants | Belarus | 100.0 /100 | #30 | Exceptional 6.6% |
| Immigrants | Moldova | 100.0 /100 | #31 | Exceptional 6.6% |
| Tsimshian | 100.0 /100 | #32 | Exceptional 6.6% |
| Immigrants | Vietnam | 100.0 /100 | #33 | Exceptional 6.6% |
| Immigrants | South Central Asia | 100.0 /100 | #34 | Exceptional 6.6% |
| Yakama | 100.0 /100 | #35 | Exceptional 6.6% |
| Luxembourgers | 100.0 /100 | #36 | Exceptional 6.6% |
| Sri Lankans | 100.0 /100 | #37 | Exceptional 6.6% |
| Hmong | 100.0 /100 | #38 | Exceptional 6.7% |
| Immigrants | Russia | 100.0 /100 | #39 | Exceptional 6.7% |
| Asians | 100.0 /100 | #40 | Exceptional 6.7% |
| Immigrants | Indonesia | 99.9 /100 | #41 | Exceptional 6.7% |
| Immigrants | Cuba | 99.9 /100 | #42 | Exceptional 6.7% |
| Bhutanese | 99.9 /100 | #43 | Exceptional 6.7% |
Demographics Similar to Apache by Unemployment Among Women with Children Under 6 years
In terms of unemployment among women with children under 6 years, the demographic groups most similar to Apache are Puerto Rican (12.5%, a difference of 1.8%), Native/Alaskan (11.5%, a difference of 6.9%), Shoshone (13.2%, a difference of 7.0%), Sioux (11.5%, a difference of 7.5%), and Chippewa (13.3%, a difference of 8.2%).
| Demographics | Rating | Rank | Unemployment Among Women with Children Under 6 years |
| Ottawa | 0.0 /100 | #327 | Tragic 9.9% |
| Tohono O'odham | 0.0 /100 | #328 | Tragic 10.2% |
| Blacks/African Americans | 0.0 /100 | #329 | Tragic 10.3% |
| Pennsylvania Germans | 0.0 /100 | #330 | Tragic 10.8% |
| Colville | 0.0 /100 | #331 | Tragic 11.2% |
| Sioux | 0.0 /100 | #332 | Tragic 11.5% |
| Natives/Alaskans | 0.0 /100 | #333 | Tragic 11.5% |
| Apache | 0.0 /100 | #334 | Tragic 12.3% |
| Puerto Ricans | 0.0 /100 | #335 | Tragic 12.5% |
| Shoshone | 0.0 /100 | #336 | Tragic 13.2% |
| Chippewa | 0.0 /100 | #337 | Tragic 13.3% |
| Pima | 0.0 /100 | #338 | Tragic 13.4% |
| Navajo | 0.0 /100 | #339 | Tragic 13.5% |
| Immigrants | Yemen | 0.0 /100 | #340 | Tragic 13.5% |
| Lumbee | 0.0 /100 | #341 | Tragic 13.8% |