Luxembourger vs Apache Householder Income Over 65 years
COMPARE
Luxembourger
Apache
Householder Income Over 65 years
Householder Income Over 65 years Comparison
Luxembourgers
Apache
$60,967
HOUSEHOLDER INCOME OVER 65 YEARS
50.0/ 100
METRIC RATING
174th/ 347
METRIC RANK
$54,668
HOUSEHOLDER INCOME OVER 65 YEARS
0.1/ 100
METRIC RATING
264th/ 347
METRIC RANK
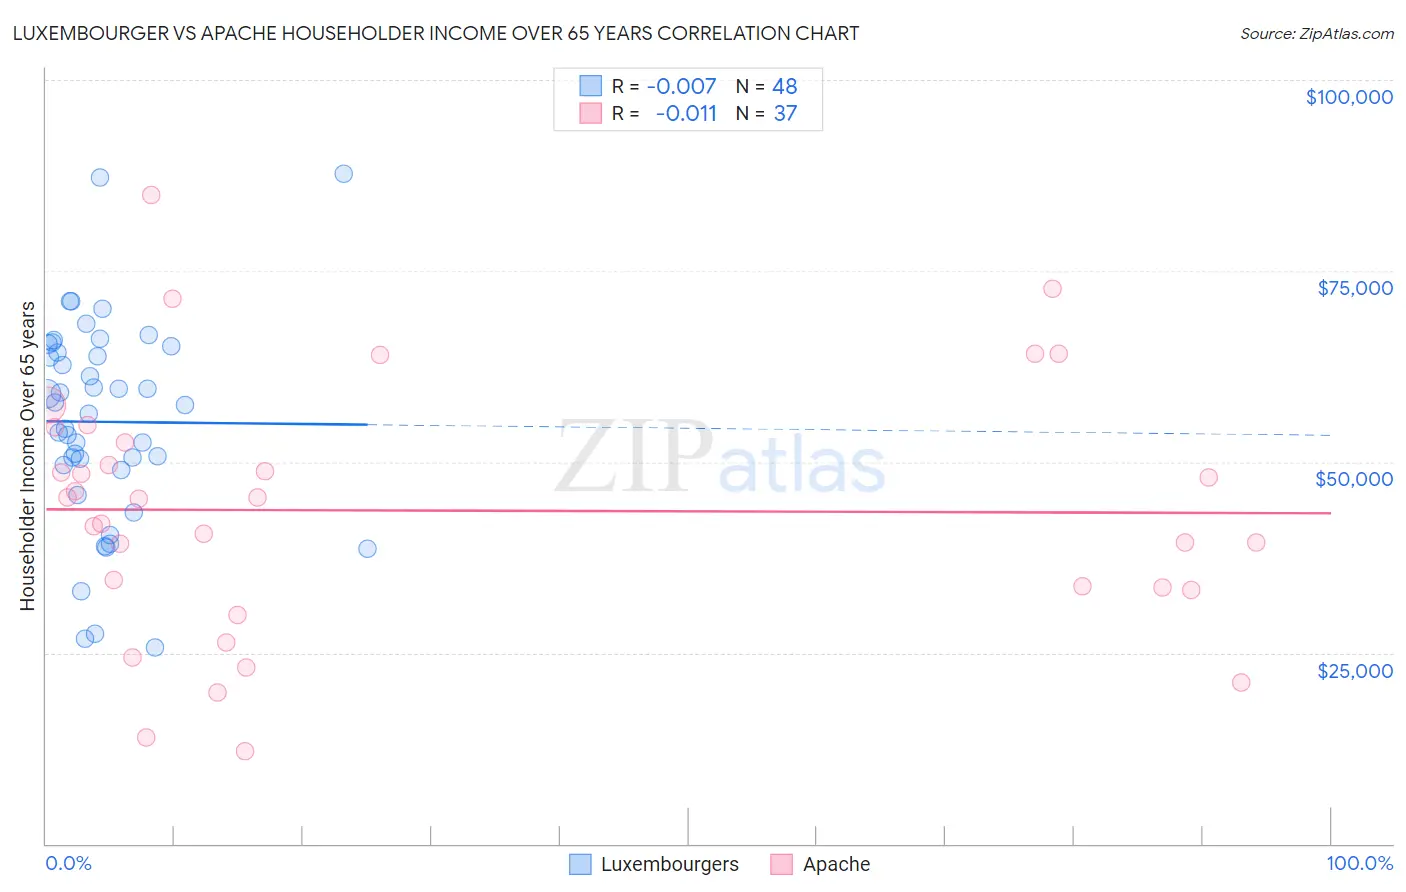
Luxembourger vs Apache Householder Income Over 65 years Correlation Chart
The statistical analysis conducted on geographies consisting of 144,531,780 people shows no correlation between the proportion of Luxembourgers and household income with householder over the age of 65 in the United States with a correlation coefficient (R) of -0.007 and weighted average of $60,967. Similarly, the statistical analysis conducted on geographies consisting of 230,476,879 people shows no correlation between the proportion of Apache and household income with householder over the age of 65 in the United States with a correlation coefficient (R) of -0.011 and weighted average of $54,668, a difference of 11.5%.
Householder Income Over 65 years Correlation Summary
| Measurement | Luxembourger | Apache |
| Minimum | $25,694 | $12,094 |
| Maximum | $87,788 | $84,879 |
| Range | $62,094 | $72,785 |
| Mean | $55,236 | $43,630 |
| Median | $56,900 | $45,246 |
| Interquartile 25% (IQ1) | $49,298 | $33,376 |
| Interquartile 75% (IQ3) | $64,744 | $53,465 |
| Interquartile Range (IQR) | $15,446 | $20,089 |
| Standard Deviation (Sample) | $13,616 | $16,595 |
| Standard Deviation (Population) | $13,473 | $16,369 |
Similar Demographics by Householder Income Over 65 years
Demographics Similar to Luxembourgers by Householder Income Over 65 years
In terms of householder income over 65 years, the demographic groups most similar to Luxembourgers are Immigrants from Micronesia ($61,000, a difference of 0.050%), Immigrants from Poland ($61,041, a difference of 0.12%), Inupiat ($61,061, a difference of 0.15%), Spaniard ($60,866, a difference of 0.17%), and Serbian ($61,087, a difference of 0.20%).
| Demographics | Rating | Rank | Householder Income Over 65 years |
| Norwegians | 53.6 /100 | #167 | Average $61,104 |
| Irish | 53.4 /100 | #168 | Average $61,097 |
| Carpatho Rusyns | 53.3 /100 | #169 | Average $61,093 |
| Serbians | 53.1 /100 | #170 | Average $61,087 |
| Inupiat | 52.4 /100 | #171 | Average $61,061 |
| Immigrants | Poland | 51.9 /100 | #172 | Average $61,041 |
| Immigrants | Micronesia | 50.8 /100 | #173 | Average $61,000 |
| Luxembourgers | 50.0 /100 | #174 | Average $60,967 |
| Spaniards | 47.3 /100 | #175 | Average $60,866 |
| Spanish | 45.5 /100 | #176 | Average $60,795 |
| Alaska Natives | 44.3 /100 | #177 | Average $60,748 |
| Yup'ik | 43.7 /100 | #178 | Average $60,727 |
| Welsh | 42.2 /100 | #179 | Average $60,666 |
| Immigrants | Morocco | 41.7 /100 | #180 | Average $60,647 |
| Celtics | 40.7 /100 | #181 | Average $60,608 |
Demographics Similar to Apache by Householder Income Over 65 years
In terms of householder income over 65 years, the demographic groups most similar to Apache are French American Indian ($54,699, a difference of 0.060%), Bangladeshi ($54,719, a difference of 0.090%), Belizean ($54,580, a difference of 0.16%), Jamaican ($54,560, a difference of 0.20%), and Guatemalan ($54,526, a difference of 0.26%).
| Demographics | Rating | Rank | Householder Income Over 65 years |
| Trinidadians and Tobagonians | 0.3 /100 | #257 | Tragic $55,327 |
| Ecuadorians | 0.2 /100 | #258 | Tragic $54,958 |
| West Indians | 0.2 /100 | #259 | Tragic $54,936 |
| Immigrants | West Indies | 0.2 /100 | #260 | Tragic $54,927 |
| Comanche | 0.2 /100 | #261 | Tragic $54,922 |
| Bangladeshis | 0.1 /100 | #262 | Tragic $54,719 |
| French American Indians | 0.1 /100 | #263 | Tragic $54,699 |
| Apache | 0.1 /100 | #264 | Tragic $54,668 |
| Belizeans | 0.1 /100 | #265 | Tragic $54,580 |
| Jamaicans | 0.1 /100 | #266 | Tragic $54,560 |
| Guatemalans | 0.1 /100 | #267 | Tragic $54,526 |
| Immigrants | Zaire | 0.1 /100 | #268 | Tragic $54,512 |
| Nicaraguans | 0.1 /100 | #269 | Tragic $54,474 |
| Immigrants | Senegal | 0.1 /100 | #270 | Tragic $54,447 |
| Liberians | 0.1 /100 | #271 | Tragic $54,356 |