Liberian vs Immigrants from Norway Unemployment
COMPARE
Liberian
Immigrants from Norway
Unemployment
Unemployment Comparison
Liberians
Immigrants from Norway
5.6%
UNEMPLOYMENT
0.9/ 100
METRIC RATING
248th/ 347
METRIC RANK
5.1%
UNEMPLOYMENT
81.8/ 100
METRIC RATING
145th/ 347
METRIC RANK
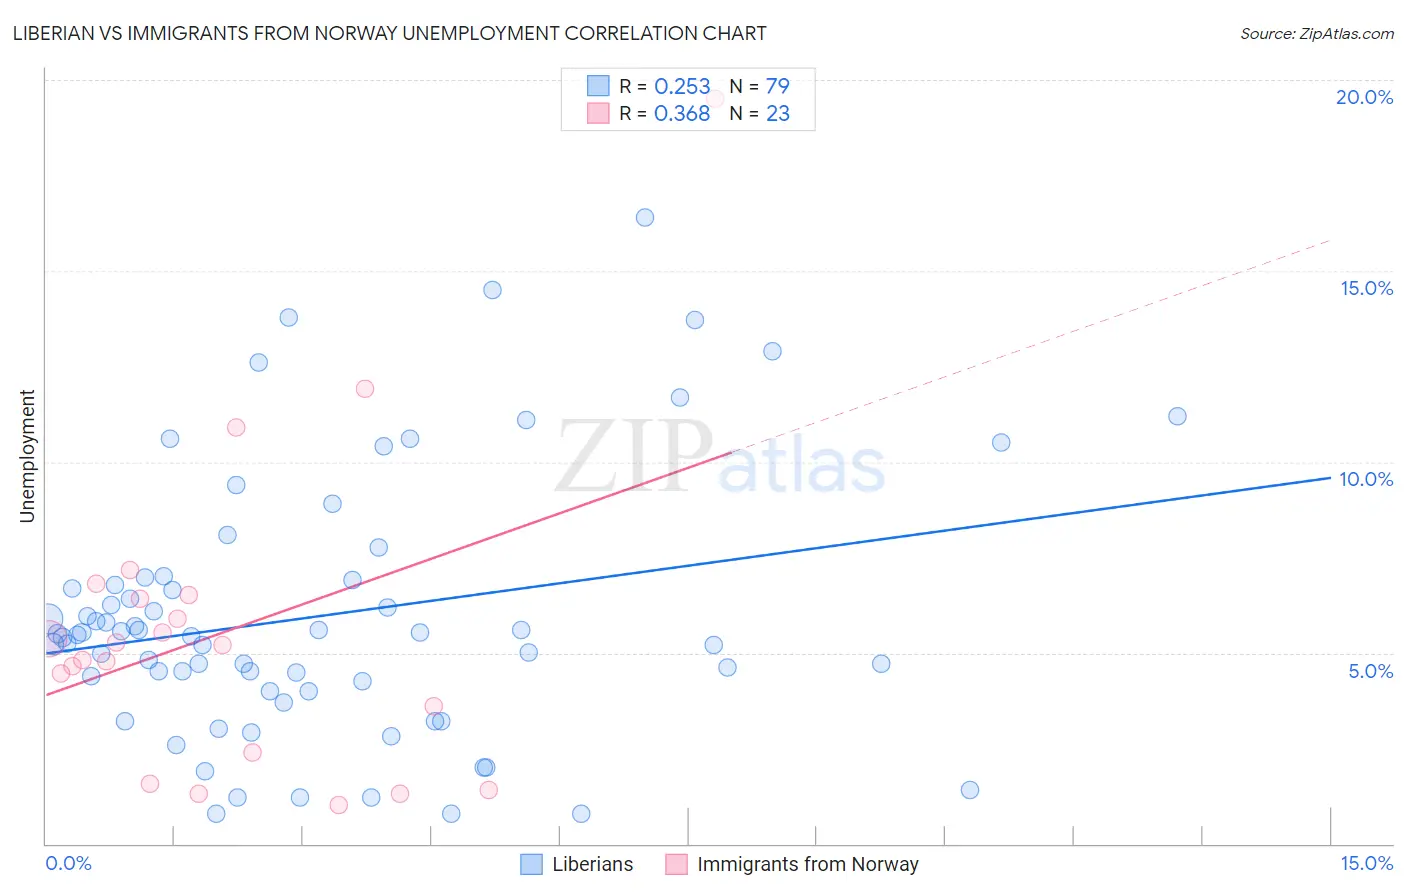
Liberian vs Immigrants from Norway Unemployment Correlation Chart
The statistical analysis conducted on geographies consisting of 118,076,237 people shows a weak positive correlation between the proportion of Liberians and unemployment in the United States with a correlation coefficient (R) of 0.253 and weighted average of 5.6%. Similarly, the statistical analysis conducted on geographies consisting of 116,646,902 people shows a mild positive correlation between the proportion of Immigrants from Norway and unemployment in the United States with a correlation coefficient (R) of 0.368 and weighted average of 5.1%, a difference of 9.7%.
Unemployment Correlation Summary
| Measurement | Liberian | Immigrants from Norway |
| Minimum | 0.80% | 1.0% |
| Maximum | 16.4% | 19.5% |
| Range | 15.6% | 18.5% |
| Mean | 6.0% | 5.6% |
| Median | 5.5% | 5.2% |
| Interquartile 25% (IQ1) | 4.0% | 2.4% |
| Interquartile 75% (IQ3) | 6.9% | 6.5% |
| Interquartile Range (IQR) | 2.9% | 4.1% |
| Standard Deviation (Sample) | 3.4% | 4.1% |
| Standard Deviation (Population) | 3.4% | 4.0% |
Similar Demographics by Unemployment
Demographics Similar to Liberians by Unemployment
In terms of unemployment, the demographic groups most similar to Liberians are Immigrants from Cameroon (5.6%, a difference of 0.13%), Cajun (5.6%, a difference of 0.26%), Japanese (5.6%, a difference of 0.27%), Bermudan (5.6%, a difference of 0.28%), and French American Indian (5.6%, a difference of 0.32%).
| Demographics | Rating | Rank | Unemployment |
| Tlingit-Haida | 2.0 /100 | #241 | Tragic 5.6% |
| Spanish Americans | 2.0 /100 | #242 | Tragic 5.6% |
| Marshallese | 1.3 /100 | #243 | Tragic 5.6% |
| Dutch West Indians | 1.2 /100 | #244 | Tragic 5.6% |
| French American Indians | 1.2 /100 | #245 | Tragic 5.6% |
| Bermudans | 1.1 /100 | #246 | Tragic 5.6% |
| Immigrants | Cameroon | 1.0 /100 | #247 | Tragic 5.6% |
| Liberians | 0.9 /100 | #248 | Tragic 5.6% |
| Cajuns | 0.8 /100 | #249 | Tragic 5.6% |
| Japanese | 0.8 /100 | #250 | Tragic 5.6% |
| Kiowa | 0.6 /100 | #251 | Tragic 5.7% |
| Hondurans | 0.3 /100 | #252 | Tragic 5.7% |
| Central Americans | 0.3 /100 | #253 | Tragic 5.7% |
| Immigrants | Honduras | 0.3 /100 | #254 | Tragic 5.7% |
| Immigrants | Portugal | 0.2 /100 | #255 | Tragic 5.7% |
Demographics Similar to Immigrants from Norway by Unemployment
In terms of unemployment, the demographic groups most similar to Immigrants from Norway are Immigrants from Asia (5.1%, a difference of 0.0%), Indian (Asian) (5.1%, a difference of 0.020%), Indonesian (5.1%, a difference of 0.050%), Immigrants from Chile (5.1%, a difference of 0.11%), and Immigrants from Pakistan (5.1%, a difference of 0.15%).
| Demographics | Rating | Rank | Unemployment |
| Immigrants | Hungary | 85.6 /100 | #138 | Excellent 5.1% |
| Pakistanis | 85.3 /100 | #139 | Excellent 5.1% |
| Immigrants | Denmark | 84.3 /100 | #140 | Excellent 5.1% |
| Palestinians | 83.4 /100 | #141 | Excellent 5.1% |
| Immigrants | Pakistan | 83.2 /100 | #142 | Excellent 5.1% |
| Immigrants | Chile | 82.8 /100 | #143 | Excellent 5.1% |
| Indonesians | 82.3 /100 | #144 | Excellent 5.1% |
| Immigrants | Norway | 81.8 /100 | #145 | Excellent 5.1% |
| Immigrants | Asia | 81.8 /100 | #146 | Excellent 5.1% |
| Indians (Asian) | 81.6 /100 | #147 | Excellent 5.1% |
| Immigrants | Italy | 79.1 /100 | #148 | Good 5.1% |
| Syrians | 77.7 /100 | #149 | Good 5.2% |
| Potawatomi | 76.2 /100 | #150 | Good 5.2% |
| Immigrants | Eastern Europe | 75.3 /100 | #151 | Good 5.2% |
| Immigrants | Hong Kong | 75.2 /100 | #152 | Good 5.2% |