Liberian vs Cree Unemployment
COMPARE
Liberian
Cree
Unemployment
Unemployment Comparison
Liberians
Cree
5.6%
UNEMPLOYMENT
0.9/ 100
METRIC RATING
248th/ 347
METRIC RANK
5.6%
UNEMPLOYMENT
2.6/ 100
METRIC RATING
240th/ 347
METRIC RANK
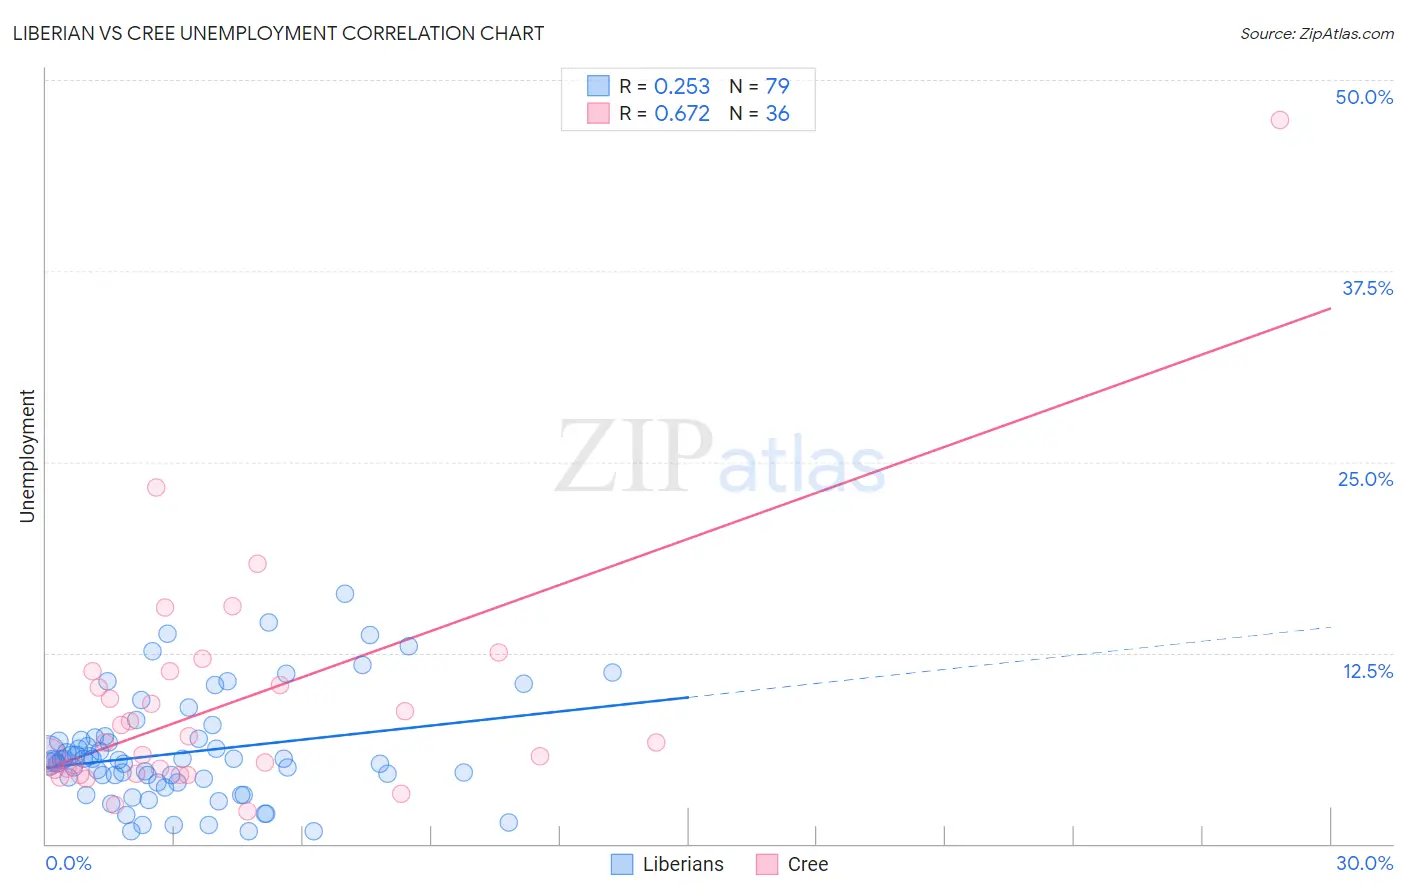
Liberian vs Cree Unemployment Correlation Chart
The statistical analysis conducted on geographies consisting of 118,076,237 people shows a weak positive correlation between the proportion of Liberians and unemployment in the United States with a correlation coefficient (R) of 0.253 and weighted average of 5.6%. Similarly, the statistical analysis conducted on geographies consisting of 76,166,078 people shows a significant positive correlation between the proportion of Cree and unemployment in the United States with a correlation coefficient (R) of 0.672 and weighted average of 5.6%, a difference of 1.5%.
Unemployment Correlation Summary
| Measurement | Liberian | Cree |
| Minimum | 0.80% | 2.1% |
| Maximum | 16.4% | 47.4% |
| Range | 15.6% | 45.3% |
| Mean | 6.0% | 9.1% |
| Median | 5.5% | 6.6% |
| Interquartile 25% (IQ1) | 4.0% | 4.7% |
| Interquartile 75% (IQ3) | 6.9% | 10.8% |
| Interquartile Range (IQR) | 2.9% | 6.1% |
| Standard Deviation (Sample) | 3.4% | 8.0% |
| Standard Deviation (Population) | 3.4% | 7.9% |
Demographics Similar to Liberians and Cree by Unemployment
In terms of unemployment, the demographic groups most similar to Liberians are Immigrants from Cameroon (5.6%, a difference of 0.13%), Cajun (5.6%, a difference of 0.26%), Japanese (5.6%, a difference of 0.27%), Bermudan (5.6%, a difference of 0.28%), and French American Indian (5.6%, a difference of 0.32%). Similarly, the demographic groups most similar to Cree are Immigrants (5.5%, a difference of 0.010%), Immigrants from Western Asia (5.5%, a difference of 0.10%), Moroccan (5.5%, a difference of 0.31%), Tlingit-Haida (5.6%, a difference of 0.34%), and Spanish American (5.6%, a difference of 0.35%).
| Demographics | Rating | Rank | Unemployment |
| Panamanians | 4.7 /100 | #234 | Tragic 5.5% |
| Immigrants | Panama | 3.4 /100 | #235 | Tragic 5.5% |
| Immigrants | Cambodia | 3.3 /100 | #236 | Tragic 5.5% |
| Moroccans | 3.2 /100 | #237 | Tragic 5.5% |
| Immigrants | Western Asia | 2.8 /100 | #238 | Tragic 5.5% |
| Immigrants | Immigrants | 2.6 /100 | #239 | Tragic 5.5% |
| Cree | 2.6 /100 | #240 | Tragic 5.6% |
| Tlingit-Haida | 2.0 /100 | #241 | Tragic 5.6% |
| Spanish Americans | 2.0 /100 | #242 | Tragic 5.6% |
| Marshallese | 1.3 /100 | #243 | Tragic 5.6% |
| Dutch West Indians | 1.2 /100 | #244 | Tragic 5.6% |
| French American Indians | 1.2 /100 | #245 | Tragic 5.6% |
| Bermudans | 1.1 /100 | #246 | Tragic 5.6% |
| Immigrants | Cameroon | 1.0 /100 | #247 | Tragic 5.6% |
| Liberians | 0.9 /100 | #248 | Tragic 5.6% |
| Cajuns | 0.8 /100 | #249 | Tragic 5.6% |
| Japanese | 0.8 /100 | #250 | Tragic 5.6% |
| Kiowa | 0.6 /100 | #251 | Tragic 5.7% |
| Hondurans | 0.3 /100 | #252 | Tragic 5.7% |
| Central Americans | 0.3 /100 | #253 | Tragic 5.7% |
| Immigrants | Honduras | 0.3 /100 | #254 | Tragic 5.7% |